


State and local pension funding is one of those perennial crises that always seem to loom but only occasionally produce limited actual disasters in places like Detroit, Puerto Rico or the smaller but more recent Chester, Pennsylvania. Essentially all 21st-century municipal bankruptcies in the U.S. are due to underfunded pension plans. But none of the defaults so far have led to falling dominoes: soaring municipal bond yields, taxpayer revolts or general government employee strikes. Will state and local pensions stagger along for the next few decades, bankrupting the odd declining city or three but not triggering a general political or economic crisis? Or are we, in Jim Steinman’s immortal words, “living in a powder keg and giving off sparks”?
The chart below is the conventional way to look at the pension situation. The vertical axis shows state and local pension assets at stated values (which often contain optimistic valuations of less-liquid assets), divided by actuarial estimates of liabilities. These are estimates by Piscataqua Research, investment consultants who follow this issue closely.
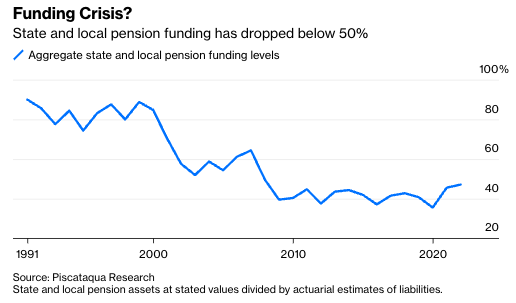
In this view, aggregate pensions were funded between 75% and 90% during the 1990s technology bubble. The internet crash in 2000 drove funding levels to nearly 50%, but the 2000s housing bubble raised them above 60%. The 2008 financial crisis brought funding levels down to 40%, where they have remained. The 2022 figure represents asset values throughout 2022 and probably overstates funding based on what assets could be sold for this month.
I think we can get more insight by looking at what engineers call a “phase space.” Instead of graphing the funding levels over time, let’s look at them compared with cyclically adjusted price-earnings ratios (CAPE). This is a measure developed by Yale professor Robert Shiller that divides current stock prices by average inflation-adjusted earnings over the past 10 years. I consider it the best standard version of price-earnings ratio. Trailing PE, based on earnings from the last quarter or year, or forward PE based on analysts’ estimates of next year’s earnings, reflect noise from the business cycle and bounce up and down too much to be useful valuation measures. CAPE is less noisy, and historically high CAPEs have generally meant markets were overvalued and would either decline or produce below-average returns in the medium term, while low CAPEs have generally been attractive times to buy stocks.
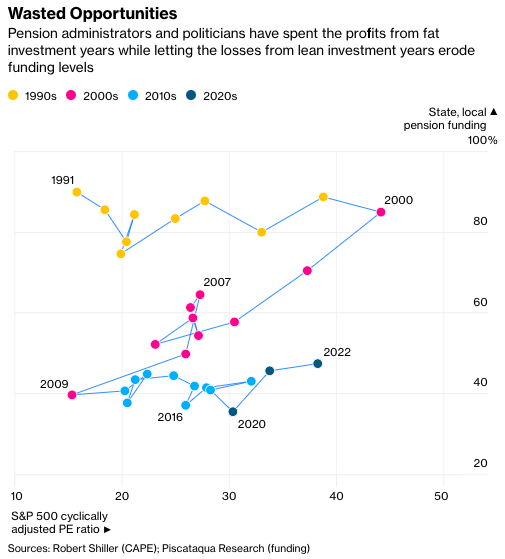
Admittedly, phase-space diagrams take a bit more work to understand than time series charts, but I think this one rewards the effort. You can see from 1991 to 2000, stock valuations nearly tripled, while pension funding levels did not change much. One is reminded of the bumper sticker seen in Silicon Valley in 2000, “Lord, give me another internet boom, I promise not to waste it” (recycled from the 1980s-era oil boom sticker). State and local pension administrators and politicians wasted the internet boom by using rising stock prices and low interest rates to cut pension funding and increase promised benefits. They did not increase reserves as CAPEs soared to 44.20, far above the 1929 peak value of 32.56, strong reason to expect either a stock crash or a decade of mediocre real returns.
Over the next decade, as CAPEs fell back to 1991 levels, pension funding fell with stock markets. There was a brief reversal during the 2003-06 housing bubble—fund administrators did not waste that one—but the subsequent housing crash and economic crisis wiped out those gains and continued the downward trajectory.
Next came the longest bull market in history from 2009 to 2022 and, like the 1990s bubble, it was wasted. Despite widespread reforms to cut benefits and increase contributions by newly hired workers, an increase in government contributions and adoption of increasingly aggressive investment strategies, February 2023 aggregate funding levels are probably similar to 2009 lows.
This is three decades of history to argue that state and local pension administrators and politicians will spend the profits from fat investment years while letting the losses from lean investment years erode funding levels. When valuations rise, they’re treated as permanent economic gains. When they drop, they’re treated as temporary mark-to-market losses that don’t affect long-term economic fundamentals. If that continues, disaster is certain whether future investment returns overall are better or worse than historical averages.
State and local pensions are a two-stage problem, and aggregate funding levels address the second stage—they measure the powder kegs, not the sparks. There are thousands of individual plans. Some are overfunded or fully funded. A few are catastrophically underfunded, to the point that no plausible level of future investment returns, tax increases, service reductions or benefit cuts can save them, especially if they are in places with declining populations and economic prospects. These are the sparks. So far, none has set off a powder keg, but it’s only a matter of time. Some plan collapse will lead to broader disaster.
If—or as I think, when—that happens, the size of the aggregate shortfall will matter. That’s the second stage of the crisis. The total loss must be absorbed by someone: lenders, local taxpayers, public employees or the federal government. Likely all four will pay some of it, which means all of us, to varying degrees, are on the hook.
—With assistance by Elaine He
This article was provided by Bloomberg News.