


6. Besides more China stimulus, what potential fundamental catalysts do you see that could help stocks continue last week’s turnaround? U.S. economic data for August to be released in September (Institute for Supply Management [ISM] Purchasing Managers’ Index on September 1 and the jobs report on September 4), the start of third quarter earnings season (late September) and the upcoming Fed meeting (September 17) are among potential market catalysts. In addition, more stimulus from central banks in Europe and Japan remains a possibility.
7. Does this latest bout of market volatility change the Fed’s timetable for interest rate hikes? Perhaps. We had previously expected the Fed to begin raising rates in December 2015, with September a possibility. We now think September may be off the table and early 2016 may be a possibility. More importantly, the trajectory of future hikes is likely to be gradual. Regardless of when the first hike arrives, we continue to see the Fed as a very manageable risk for stocks this year.
8. What are some attractive buying opportunities resulting from the latest declines? With most everything “on sale,” we increasingly like what we have liked best all year—U.S. large cap growth stocks. At the sector level, that means technology, industrials, consumer discretionary and biotech, which we would expect to outperform should stocks move higher over the balance of 2015. We also continue to like high-yield bonds on the fixed income side, where we see value amid energy sector default fears.
9. Should I sell my emerging market equities positions due to Chinese weakness? For suitable investors, we suggest holding on to modest emerging market equities positions due to the long-term value in the asset class. Although it may take some time for that value to be realized, we expect additional bold stimulus from China, eventual (hopefully fairly soon) stabilization in commodity prices and the export boost from weaker currencies to help spur the next move higher in emerging markets, particularly in Asia.
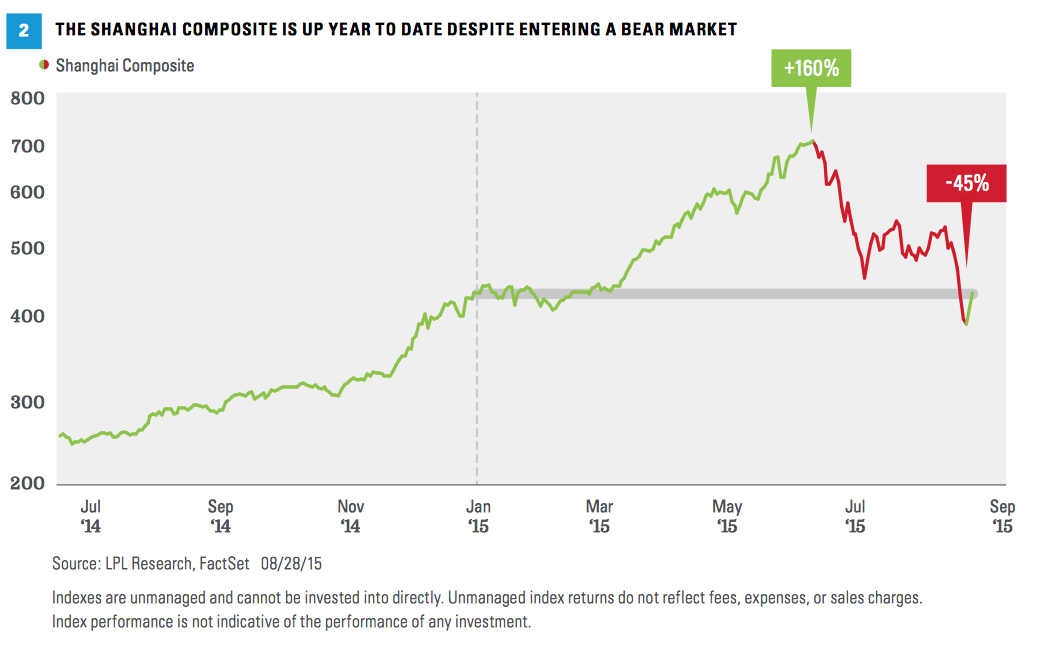
10. Is 1998 a good comparison to 2015? In some respects, yes. That year, not unlike today, an Asian currency crisis drove sharp losses overseas and contributed to the S&P 500 being down year to date at the end of August. The index rallied sharply during the last four months of that year to end 1998 with a stellar 27 percent gain. We are certainly not suggesting we’ll get a rally like that (a series of Fed rate cuts in late 1998 is one major difference between then and now, in addition to burgeoning internet mania). But we do believe U.S. stocks have the potential to stage a rally and end the year with respectable gains, despite China’s currency devaluation and its increased economic significance.
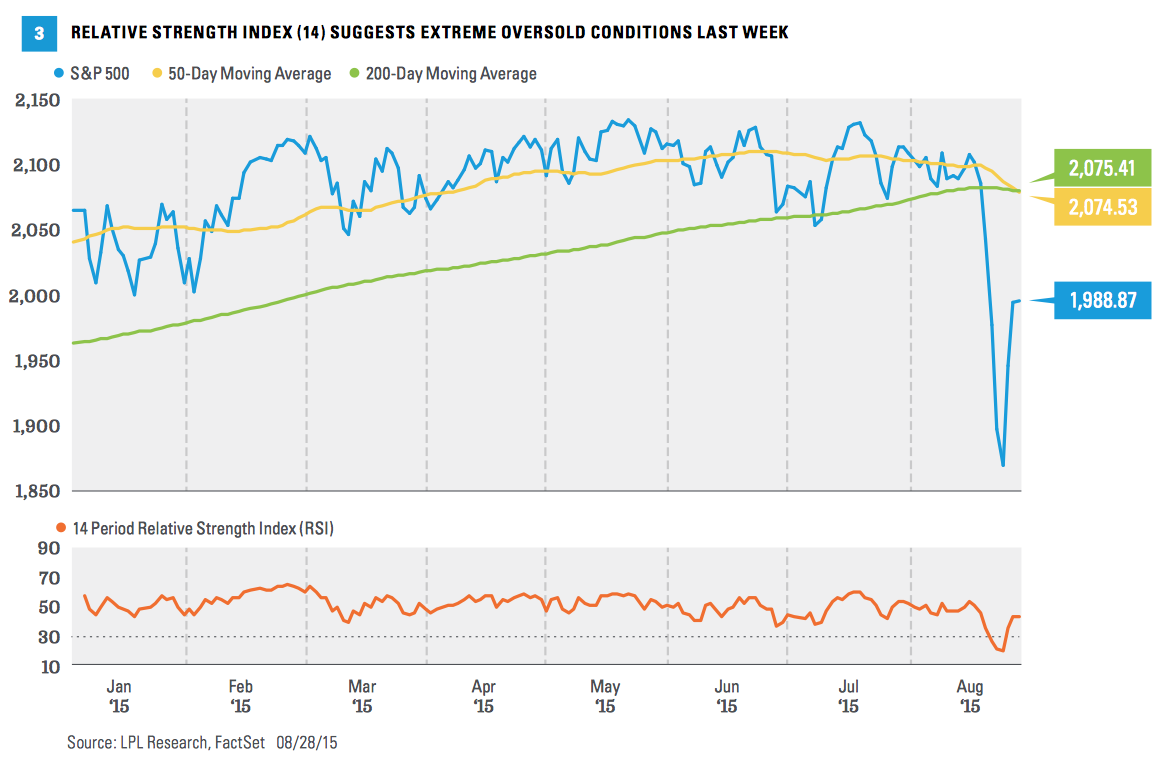
11. What technical indicators are you watching to indicate stocks have bottomed? The 14-day Relative Strength Index, RSI(14), a technical momentum indicator that compares the magnitude of recent gains with recent losses in an attempt to determine overbought and oversold conditions, has reached severe oversold levels [Figure 3], increasing the likelihood of a short-term bottom (below 30 is considered oversold). In order to confirm a short-term bottoming process, we are looking for a series of higher highs and higher lows on both the price and the RSI(14), strengthening breadth (broad participation) and high-volume positive sessions. To identify a reversal of the latest downtrend, we are watching for the S&P 500 to sustain a close back above its 50- and 200-day moving averages and a daily RSI(14) reading above 50.
5. Will China’s currency be devalued further and, if so, what might the impact be? China will likely again widen its currency trading band, which will effectively be a devaluation given the peg to the U.S. dollar is keeping the Chinese currency artificially strong. We would expect additional moves to be gradual and have limited impact on the U.S. given the small amount of U.S. exports to China. The move has the benefit of lowering costs for U.S. companies sourcing goods in China and may help support U.S. company profit margins. The biggest impact may be on other Asian nations competing with China in trade.
Twelve Questions For A 12 Percent Correction
September 3, 2015
« Previous Article
| Next Article »
Login in order to post a comment