


Value investors rarely agree on how to pick stocks. Their objective is generally the same — to buy companies as cheaply as possible — but there’s no consensus about how to measure cheapness. Some look for a high dividend yield, others for a low stock price relative to a company’s assets, earnings or cash flow, and there are numerous variations on those themes.
For most of the past 100 years, it didn’t matter because value stocks paid by any measure. Sure, some value strategies performed better than others, but value stocks almost always beat growth ones and the broad market over multiyear periods, the notable exceptions being the years around the Great Depression in the 1930s and the dot-com bubble in the late 1990s. All value investors had to do was show up.
But the great value bonanza came to a sudden halt just before the 2008 financial crisis. From 2007 to 2020, value lagged growth and the broad market by a crushing margin, and nothing sends investors back to the drawing board like a long bout of disappointment. Every value strategy was scrutinized and challenged, and none more so than the price-to-book ratio.
And that’s no ordinary ratio. The academic research in the early 1990s that documented value’s historical success and thereby popularized value investing used P/B ratio to sort cheap stocks (value) from expensive ones (growth). In simple terms, the lower the stock price relative to a company’s assets minus its liabilities, or “book” value, the cheaper it is. For many investors, P/B became synonymous with value.
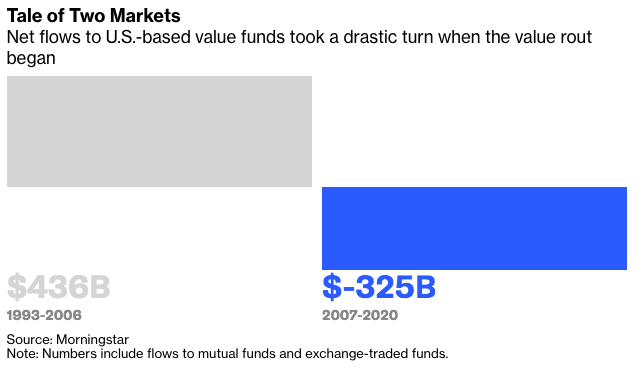
Once word of the so-called value premium got out, investors poured money into value strategies. In 1992, U.S.-based value funds managed about $100 billion, according to Morningstar. From 1993 to 2006, they took in $436 billion, much of it going to funds using P/B ratio to pick stocks.
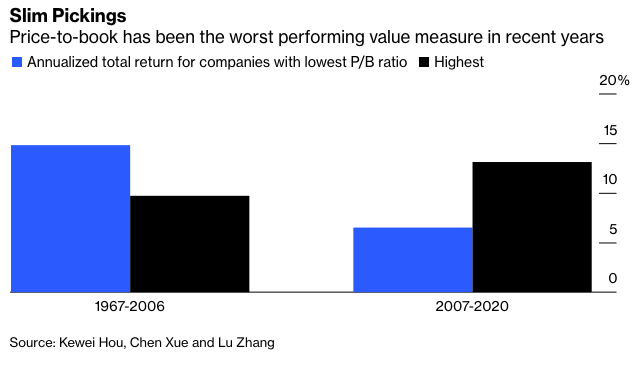
As it turned out, P/B was the worst performer of the value measures during the ensuing 14-year rout. The magnitude of the reversal was truly shocking. From 1967 to 2006, the cheapest 30% of U.S. stocks sorted by P/B and weighted by market value outpaced the most expensive 30% by 5.1 percentage points a year, including dividends, according to numbers compiled by financial economist Lu Zhang and his colleagues. But from 2007 to 2020, the cheapest 30% of stocks lagged the most expensive ones by 6.6 percentage points a year.
Given P/B’s leading role in popularizing value investing, its reversal raised doubts not only about its merit relative to other value measures but about value investing itself. Investors didn’t hang around for answers. They pulled $325 billion from value funds from 2007 to 2020 — three-quarters the amount they had invested during the previous 14 years.
Meanwhile, what was once a leisurely debate about optimizing value portfolios turned into a scramble for answers. P/B’s adherents rushed to defend it, while those who favored other value measures moved to distance themselves from it. All of which raised the question: What happened to P/B?