


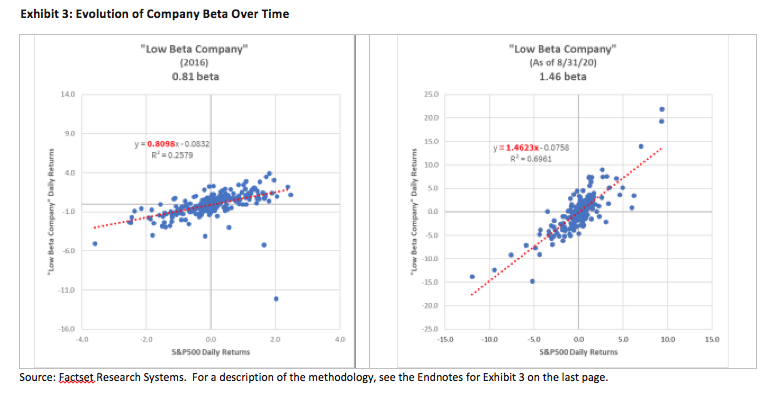
While beta is a good approximation of risk, it must be taken into consideration with other measures like standard deviation, or volatility. The other important matter is that risk, no matter how it’s measured, is always changing. As seen in Exhibit 3, a company with a lower than market beta (below 1), is shown in 2016. The beta sensitivity to market changes is illustrated by the red trendline. The flatter the trend line, the lower beta. Conversely, the steeper the trendline, the higher the beta. However, when looking at the trendline from 2016 vs. that as of August 2020, one could see that the beta almost doubled, to 1.46, which greatly steepened the trendline. The result of this evolution was that the once low beta company with limited sensitivity was now moving with greater sensitivity than the broader market.
Interestingly, this same phenomenon can happen to entire sectors as well. In 2007 financials were low beta but by mid-2008 almost the entire sector transformed toward high beta as the credit crisis unfolded. Risk like all things needs to be managed, monitored and addressed.
Dividend Growth Within Portfolios
Given the previously mentioned benefits, the case for dividend growth remains strong from a risk/reward perspective. These characteristics create a strong reason for including companies into a diversified portfolio that possess shareholder friendly dividend policies, strong balance sheets, and fundamental strength for future dividend growth. Many companies are well positioned to continue to increase their dividends over the long term. According to Harvard Business Review, companies continue to maintain very high levels of cash on their balance sheets, with corporate cash balances at $4 trillion, which is up from $2.7 trillion a decade ago (Source: Hankins, Kristine and Petersen, Mitchell—2020, January 17—HBR: Why Are Companies Sitting on So Much Cash?). As a result, corporate management teams have the means and motivation to focus more on dividend growth as a way of rewarding shareholders.
James Boothe is chief investment officer at Brentview Investment Management.
Why Dividend Growth?
October 13, 2020
« Previous Article
| Next Article »
Login in order to post a comment