


Gold and U.S. Treasuries may be considered “safe haven” investments but do carry some degree of risk. Fast price swings in gold can result in significant 
Gold As Jewelry
Jewelry composes more than half of all global gold demand, according to the World Gold Council, and therefore, is an important piece of the overall gold picture. In 2015, jewelry-related gold demand was lackluster, falling 3% versus 2014. The global jewelry market did show signs of improvement in the second half of the year, including strength in India, one of the biggest gold jewelry markets in the world, and growth in the U.S. However, the total global market continues to face headwinds with lackluster demand in Europe, a mixed picture across Asia, and weakness, not surprisingly, in oil-sensitive areas in Russia and the Middle East. Jewelry demand may stabilize in 2016, but at this point we would consider it a slight headwind for the near-term gold outlook.
Technical Outlook
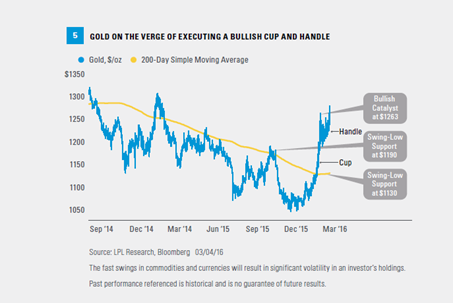
Gold’s technical picture is positive, in our view. Its price has been operating in a daily upward sloping trend and may be close to executing what is known as a bullish cup and handle pattern [Figure 5]. A bullish breakout would take place when gold’s price closes back above the handle, in this case at $1,263; this would increase the likelihood for a continued move higher, targeting a price objective at $1,350 over a six- to nine-month time horizon. Conversely, a closing price below the swing-low level at $1,190 would increase the likelihood of a false signal and increase the probability of a continued move lower, targeting support at the 200-day simple moving average at $1,130.
Interestingly, on a long-term chart gold has retraced about half of its bull market run of the 2000s, indicating the long-term bull market remains intact. Considering gold is coming off of its biggest three-year loss (2013–15) in over 40 years and the commodity has underperformed the S&P 500 by more than 100 percentage points since its August 2011 peak, the upside potential looks attractive.
We also look at sentiment measures to gauge the possible next move for gold from a technical perspective. One way to do that is to use the Commitment of Traders (COT) data for the gold futures market. On that measure, which shows the ratio of buyers versus sellers in that market, both commercial buyers and speculative (financial) buyers are net long, which indicates a potentially overbought situation. In addition, a variety of surveys cited by Ned Davis Research point to a high level of gold optimism.
Conclusion
When analyzing the key drivers of gold prices, we see more positives than negatives. Rising inflation, increasing policy risk, the likely gradual path of Fed rate hikes (which may keep the dollar stable), negative short-term real interest rates, and a positive technical picture all suggest renewed potential gains for gold. But gold faces headwinds in the form of potential additional dollar strength from impending Fed rate hikes, signs of overly optimistic sentiment, and soft jewelry demand. We believe the positives may outweigh the negatives and that a modest gold allocation makes sense for suitable investors as additional gains may lie ahead.