Investment Strategy Is All About Decisions And Outcomes
Even for investors who are skeptical of the efficient market hypothesis, there is no denying that investing is difficult. We make decisions under tremendous uncertainty, not only about what real world events will transpire but indeed about how market prices will react to these events. We investors must make decisions in the presence of this uncertainty, knowing that not all decisions will pay off. Sometimes good decisions are met with bad outcomes, and sometimes bad decisions are met with good outcomes. We can only control our decisions and expect that good decisions will pay off, on average, over the long run.
Diversification Is A Good Decision
Diversification offers one of the best opportunities in all of investing. By combining dissimilar investments in our portfolios, we earn the weighted average of the returns of these investments. However, we do not retain the weighted average volatility (risk) of these investments. Because we can usually expect some of our investments to pay off even while others struggle, we generally see that diversification reduces some of the ups and downs of investing at the overall portfolio level. For this reason, diversified portfolios, over time, offer more return per unit of risk than concentrated ones.

Source: Columbia Threadneedle Investments, 12/15
Equal weighted average of 10 major markets, 1970–2015: U.S. stocks represented by S&P 500 Index, international stocks represented by MSCI EAFE Index, U.S. government bonds represented by Barclays U.S. Treasury Index, international government bonds represented by Citigroup World Non-U.S. Government Bond Index, high yield represented by Barclays High Yield Index, investment grade represented by Barclays U.S. Corporate Bond Index, securitized represented by Barclays U.S. Mortgage-Backed Securities Index, TIPS represented by Barclays Global Inflation-Linked Index, commodities represented by Dow Jones-UBS Commodity Index and REITs represented by FTSE/NAREIT Index. If a particular index did not have a sufficient track record back to 1970, a representative index of similar risk/return characteristics was used.
Spreading investment portfolios across numerous asset classes has a great track record
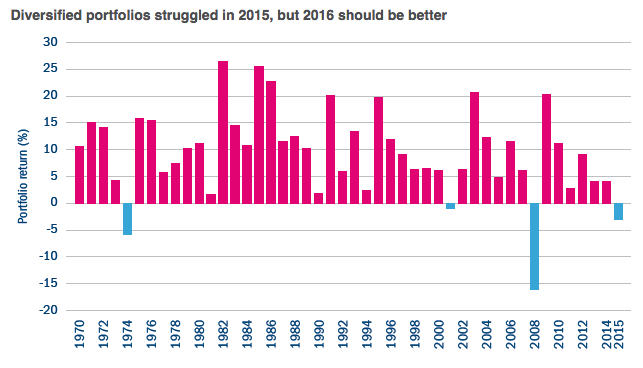
A simple, diversified portfolio strategy produces a positive return in the vast majority of years (see chart). Notice that since 1970, a diversified approach produces a positive return in most years, and that these returns can be quite meaningful much of the time. In fact, the example portfolio would have produced an average return of 9.8% through 2014, with only three down years over that span.
Yet 2015 delivered very bad outcomes for diversified investors
Glancing at the chart, we can easily see that, in context, 2015 was a horrible year for diversified investors. In fact, with the exception of the great financial crisis of 2008, 2015 delivered the worst outcome to diversified investors since 1974. This simple observation was nearly absent from most market commentary in 2015. But let’s be clear, 2015 was a historically awful year for diversified portfolios.
2016 should be better. It seems a fairly safe presumption that diversified portfolios will fare better in 2016 than in 2015
Historically, after each of the prior three negative years, the following year delivered firmly positive returns. More to the point, however, we note that many of the asset classes reflected in this chart experienced a meaningful reset of their forward-looking risk premia (in other words, their expected returns). High-yield bonds, for example, offered yields 277 basis points higher than in the middle of 2014.* Commodities too must have a somewhat more limited downside with oil at $40 per barrel than with oil at $100 per barrel.
Diversification almost always works. For investors frustrated by performance in 2015, we confidently recommend that you stay diversified with a keen eye to how your risks are allocated.
* The high-yield option-adjusted spread (OAS), a measurement of the spread of a fixed-income security rate and the risk-free rate of return, had a low of 3.23 on June 23, 2014 vs. 6.00 on December 7, 2015.
Jeff Knight is global head of investment solutions and asset allocation for Columbia Threadneedle Investments. Mr. Knight leads a team of six portfolio managers responsible for our broad suite of multi-asset strategies including capital allocation, risk allocation, absolute return and total return funds.


