


The charts highlight the similarity of the hypothetical performance with the actual performance -- all cumulative hypothetical growth values are within pennies of the actual growth values, with similar volatility characteristics.
Over their respective longest concurrent periods, cross-correlations of the hypothetical strategies versus the actual composites were high, as follows: DGP 0.93; DGI 0.88; HIB 0.65; IBP 0.60. Risk as measured by the monthly standard deviation of the results is also quite similar.
Return, Risk And Risk-Adjusted Return
Investors are concerned with risk as well as return. The terminal values illustrated in charts 1, 2A and 2B illustrate the compounded cumulative return of a hypothetical $1 investment; the variability of each performance record indicates the risk inherent in each strategy.
In Chart 3, we display the 85-year hypothetical performance illustration of the strategies from another perspective -- in mean-variance space. This view plots the hypothetical return, along the vertical axis, versus the risk of loss, along the horizontal axis. One benefit of this graphical approach is that investments with various levels of risk can be compared in an apples-to-apples fashion.
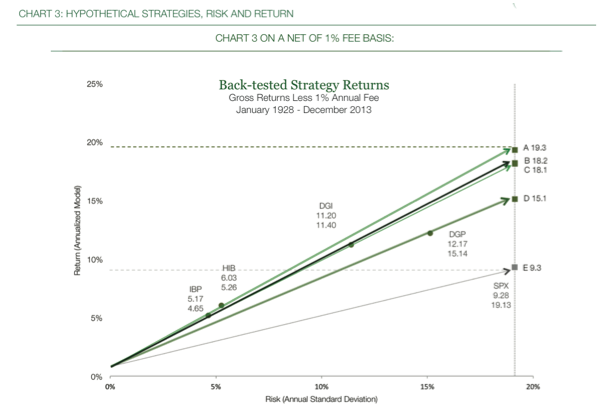
Chart 3 highlights an important benefit of how the WBI investment approach can be superior to a passive investment in a market index. Some strategies, such as DGP and DGI, are designed to have more aggressive investment profiles, meaning they seek higher returns. Other strategies, such as HIB and IBP, are designed to have more conservative performance, meaning they seek lower risk. All the strategies are designed to have better risk-adjusted performance than the market overall. Chart 3 illustrates that, over the long run, these strategies can accomplish their stated goals. In the back-tested illustration, all of the strategies exhibited significantly lower risk than the market.
Lower risk translates into losing less in the strategy than the market loses when it declines. Over time, compounding gains along with such limited losses can have a large impact on the total value of compounded wealth, as we saw in Chart 1. The lines connecting each strategy from an assumed risk-free rate of 1 percent in Chart 3 provide more insight into the true value of such a risk-managed investment approach. The slope of these lines shows graphically a statistic commonly used to measure risk-adjusted return, the Sharpe Ratio. The higher the Sharpe Ratio, the better. The points A, B, C, and D, where, if we were to lever strategies to the same level of risk as the market, show the risk-adjusted returns of each strategy, graphically displaying another risk-adjusted return statistic, the Modigliani-Modigliani measure known as M-squared. For example, point A shows that the hypothetical risk-adjusted return of a strategy replicating HIB is 19.3 percent, which is more than double the market return of 9.3 percent at the same level of risk. Point B shows the hypothetical risk-adjusted return strategy replicating DGI is 18.2 percent; point C shows that the hypothetical risk adjusted return of a strategy replicating IBP is 18.1 percent; and point D shows that the hypothetical risk-adjusted return of a strategy replicating DGP is 15.1 percent. Chart 3 shows that by both measures, Sharpe Ratio and M-squared, all of the back-tested strategies have higher risk-adjusted returns than the market.
Conclusions
We believe investors need to replace antiquated diversification risk-reduction strategies with a more capture-ratio-oriented approach to find managers who have demonstrated the ability to provide the desired blend of return and risk management based on client risk profiles. Selecting managers who have historically demonstrated performance with a desirable blend of up and down-market capture ratios should allow investment allocators to develop portfolio allocations that will allow investors to stay more comfortably invested for the long run, and especially when markets turn bearish.
Donald Schreiber, Jr. is CEO and co-portfolio manager of WBI Investments Inc., which manages $2.6 billion for financial advisors and their clients. Since founding the firm in 1984, Schreiber has focused company resources on developing the firm’s proprietary value-oriented, dividend-based, risk-managed investment approach.
Craig French is portfolio manager for WBI Investments Inc. French previously worked at Lasair Capital as senior investment officer. Prior to his tenure with Lasair Capital, French was a partner and director of Risk Management and Quantitative Research at Corbin Capital Partners. Previous to joining Corbin, French was the U.S. Equity Strategist for SEI Investments.and an analyst and associate at Goldman Sachs Asset Management.