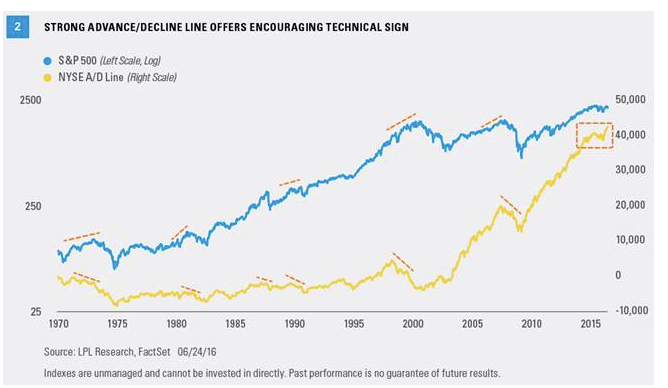
Market breadth, the number of stocks participating in a rally, currently offers an encouraging technical sign. We mentioned strong market breadth as a reason for optimism in last week’s Weekly Market Commentary. One of our favorite ways to measure market breadth is via advance/decline lines (A/D lines). A/D lines are computed daily by adding the number of securities in an index that are higher and subtracting the number that are lower. An upward-trending A/D line indicates broad participation and underlying strength, a good sign.
The New York Stock Exchange (NYSE) A/D line was actually higher last week, closing at a new weekly all-time high in the process. This indicator tends to lead actual price, so this new high could bode well for equities over the coming months. As Figure 2 shows, at all major market tops, the NYSE A/D line broke down in advance of the actual peak in equities. In other words, breadth provided a warning sign at every meaningful market peak. We consider the lack of a warning sign to be encouraging.

CONCLUSION
We know markets do not like uncertainty, and the U.K.’s vote to leave the EU has introduced new economic and political uncertainty that likely won’t go away quickly; but there are enough positives for this market to give us the confidence that 2016 can still be a positive year for U.S. stocks. We may be in for some more volatility, but long-term investors should stick to their plans. More tactical investors may want to consider a slightly more conservative stance in the near term until we have more clarity on the political landscape.
Burt White is chief investment officer for LPL Financial.


