


2. Volatility has eased (and its term structure has normalized; meaning forward expectations for volatility have come down).
3. On February 12, 16 and 17 the S&P 500 gained more than 1.5% each day for three consecutive days. According to MarketWatch, this has only happened eight times since 1970 and every time, the market was higher a year later by an average of more than 19%.
4. Fourth quarter 2015 U.S. real gross domestic product (GDP) was revised from 0.7% to 1.0%, relative to consensus expectations it would be revised down to 0.4%.
5. The headline January Durable Goods (+4.9%) and Industrial Production (+0.9%) reports were better than expected (consensus expectations were +2.9% and +0.4%, respectively).
6. Initial unemployment claims remain comfortably below 300k (with last week’s reading coming in at a very low 262k).
7. Oil prices appear to be in a bottoming pattern; with the old resistance from the downtrend now serving as support; while the U.S. dollar has been consolidating its prior gains for a year now (i.e., the currency/commodity headwinds are fading).
8. China’s stock market weakness is not decimating the U.S. stock market like in the recent past (last week’s rout did not see follow-through in U.S. markets); and the correlation between the two markets has plunged.
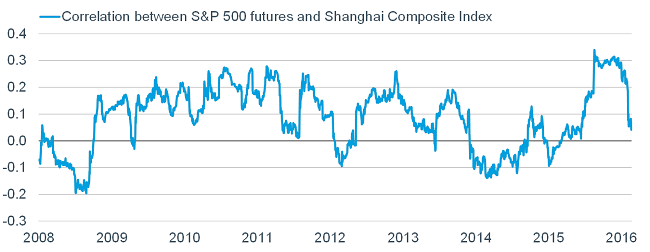
Source: Bloomberg, FactSet, as of February 26, 2016. Rolling 120-day correlation between daily % change in S&P 500 futures and China Shanghai Stock Exchange (SSE) Composite Index. S&P 500 futures based on the Chicago Mercantile Exchange (CME) E-mini S&P 500 front-month continuous contract.
9. Inflation is ticking higher and getting closer to (or above) the Fed’s 2% target. (The PCE is the Fed’s “preferred” measure).
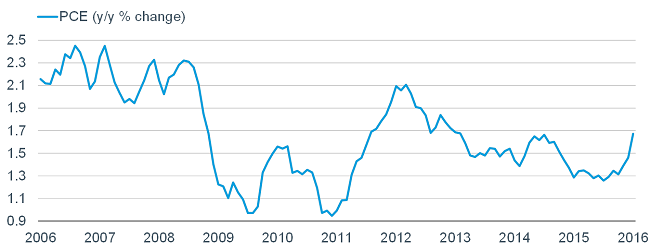
Source: FactSet, as of January 31, 2016.
10. Expectations for the Fed raising rates in March have ticked up (albeit to a still low level), while the market’s been rallying—suggesting perhaps that good economic news is good news! Confirming this is the much higher correlation between the S&P 500 and the Citigroup Economic Surprise Index (which measures how economic data is coming in relative to expectations).
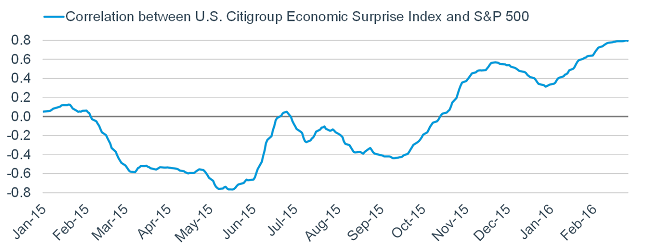
Source: Cornerstone Macro, FactSet, as of February 26, 2016.Rolling 90-day correlation between U.S. Citigroup Economic Surprise Index and S&P 500.
I wish I could put the election season and political discourse on the top-10 list, but there doesn’t appear to be a chance of improvement there any time soon. However, in keeping with the theme in this report of finding optimism, I will close with a page from Warren Buffett.
In his latest letter to shareholders, Buffett wrote: “As a result of this negative drumbeat, many Americans now believe that their children will not live as well as they themselves do. That view is dead wrong: The babies being born in America today are the luckiest crop in history.”
As reported by BloombergBusiness, while he touched on risks including terrorism, cyber warfare, climate change and economic dislocation for workers, Buffett also suggested that the picture of woe was generated out of politicians’ self-interest, not because it accurately reflects the nation’s challenges: “It’s an election year, and candidates can’t stop speaking about our country’s problems (which, of course, only they can solve).”
Politicians are self-interested? I hadn’t noticed. Investors are dour? I have noticed. There are reasons for optimism? Take notice; there are many.
Liz Ann Sonders is chief investment strategist at Charles Schwab & Co.
Read more here.