


As investors, we naturally aim to understand what is and what is not discounted by financial markets. Of course, this is a difficult feat as it implies we know something about our stocks that others do not. Since the turn of the century, markets have become more informationally efficient and rapidly incorporate new information into stock prices.
Rather than just ask “what do we know that others do not?”, our Global Long/Short team likes to explore the deeper questions about investor beliefs. These determine how investors incorporate information into the investment problem itself and thus, how they arrive at their decisions.
We all bring all kinds of beliefs to the investment task. For example, some believe that value investing works and valuation inputs should be paramount. Others prefer to invest in growth stocks and dismiss the value of dividends. Some believe that technical analysis is superior to a fundamental approach and so forth. But how do investors arrive at these beliefs and what is the evidence for such?
One commonly held assumption is that today’s financial landscape is dangerously fragile. This is the outcome of the trauma of the Global Financial Crisis and its aftermath in particular. Are investors correct that unforeseen risks lurk around every corner? Only time will tell. But one sanguine perspective is illustrated below, the Overall Index of Systemic Vulnerability constructed by the Federal Reserve. This implies that the structural risks, which culminated in the Global Financial Crisis of 2008, are no longer present.
Figure 1. The Financial and Economic Landscape: Stronger than Many Believe?
Overall Index of Systemic Vulnerability
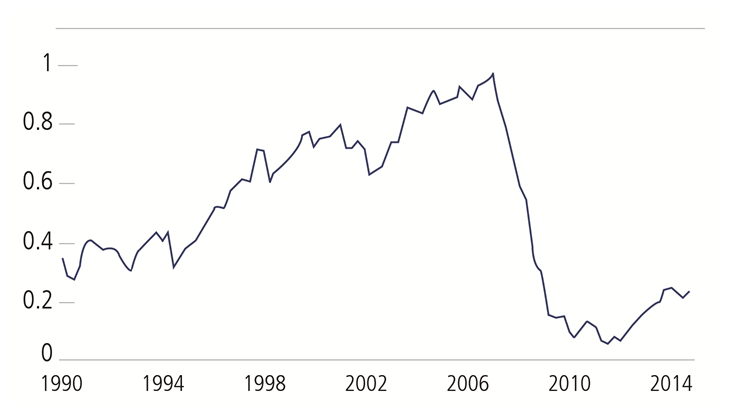
Source: Federal Reserve, quarterly data. The Overall Index of Systemic Vulnerability is constructed using inputs for Risk Appetite and Asset Valuations, Financial Sector Vulnerability, and Nonfinancial Sector Imbalances; more detail can be found here: https://www.federalreserve.gov/econresdata/notes/feds-notes/2015/mapping-heat-in-the-us-financial-system-a-summary-20150805.html
If investor belief in economic fragility is misplaced, as the chart above implies, is everyone overpaying for “safety stocks”? For example, many consumer staples stocks trade at premiums to the market and to their own history despite negligible growth. Investors appear to be paying for the stability and defensiveness of these companies rather than their long-term potential.
Another widespread belief is that the S&P 500 Index is “overvalued” and thus, lacks upside potential. As shown in Figure 2, the median P/E for the S&P 500 is higher today than its average of the past 50 years. That said, stocks have been sustained near today’s valuations for long periods, including the bull market of the 1990s.
Figure 2. Is the S&P 500 Overvalued?
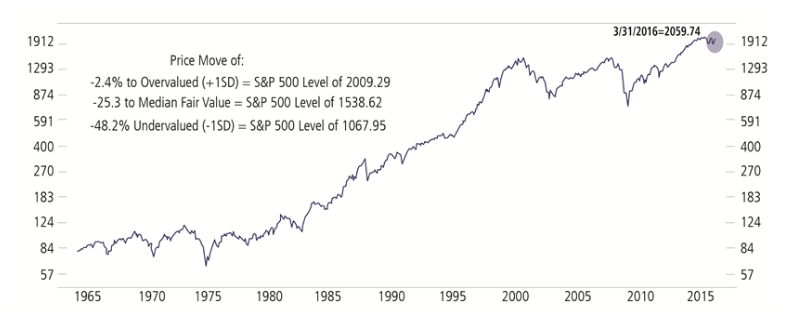
S&P 500 Median P/E with Historical Median
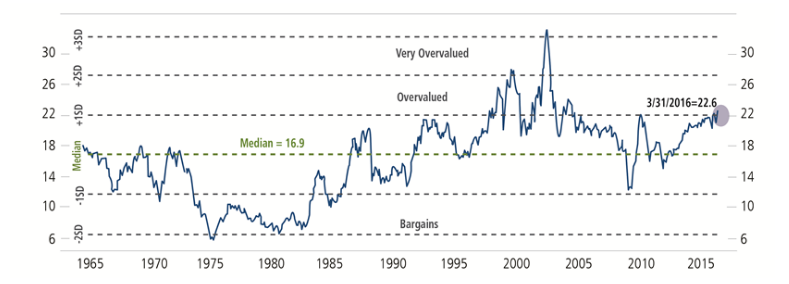
Past performance is no guarantee of future results. Source: Ned Davis Research. Median Price/Earnings ratio is calculated by Ned Davis Research. SD: Standard deviation. Copyright 2016 Ned Davis Research, Inc. Further distribution prohibited without prior permission. All Rights Reserved. See NDR Disclaimer at www.ndr.com/copyright.html. For data vendor disclaimers refer to www.ndr.com/vendorinfo/.