


Risk-On/Risk-Off: The Good, Bad And Ugly
Interest Rate And Managed Futures: A Tangled Web
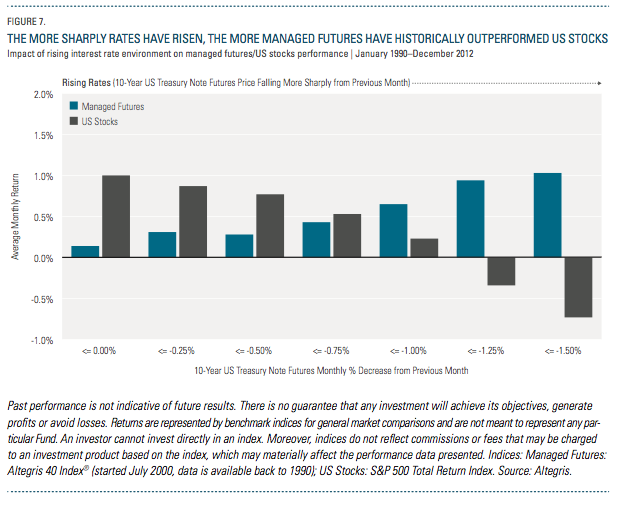
A commonly held belief among industry observers is that managed futures only deliver strong returns when interest rates go down. But it so happens that managed futures have also experienced positive monthly returns during periods in which rates have risen and bond prices have fallen. This is because managed futures managers are agnostic to the direction of interest rates, and simply require an up trend or a down trend to potentially profit.
For example, managed futures returns on a weighted average monthly basis were 0.14 percent when rates merely declined, while US stocks returned 1.00 percent. Conversely, when rates were sharply rising, managed futures returned 1.03 percent on a weighted average monthly basis, while US stocks were down -0.73 percent.
If such a rising-rate market were to develop—which is far more a matter of when, not if—managed futures managers could find themselves in an enviable position.
Managed Futures Industry Growth: Fact And Fiction
LookIng Forward: BIgger, But Not Too BIg
ConclusIon
So do we.
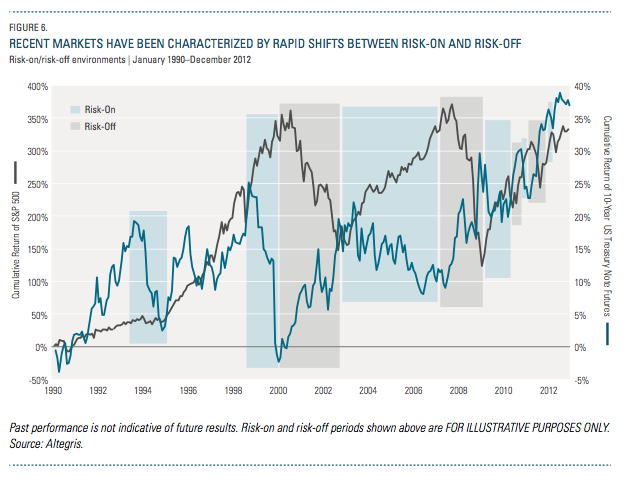
Risk-on periods—which are perceived to be periods of positive returns for traditional long-only investments and general optimism in the markets— have historically been conducive to long positions in stock index and commodity futures, and short positions in interest rate futures and the US dollar.
On the other hand, risk-off periods—which are perceived to be associated with downturns in stocks and general negativity in the markets—are normally supportive of the opposite positions: long interest rate futures and the US dollar, and short stock index and commodity futures.
We have frequently discussed these pervasive risk-on and risk-off environments over the last few years. Just when it seemed that global markets were headed in a directionally positive manner, global shocks such as the Japanese tsunami in Q1 2011, the European debt crisis or the government spending clash in the US thwarted risk-on trends and reversed markets to more of a risk-off stance. Conversely, in the summer of 2012, when the risk-off trend was pervasive, Chairman Mario Draghi’s announcement of unlimited sovereign debt purchases by the European Central Bank created a positive reversal.
A bedrock principle of managed futures is that they simply require persistence of trends—in either direction—in order to potentially deliver strong returns. What presents challenges for managed futures managers is constant flip-flopping between risk-on and risk-off—as has been the case recently.
Figure 6 illustrates what we consider to be risk-on and risk-off periods. Timeframes that we characterize as risk-on are defined by periods in which the stock market is generating positive cumulative returns while fixed income markets exhibit declining cumulative returns. Risk-off environments typically occur when fixed income markets are generating positive cumulative returns while the stock market exhibits negative returns.
Our research reveals that times of positive performance in managed futures are typically driven by sustained periods of either risk-on or risk-off environments that supply markets with ample price trends. From a historical perspective, extended risk-off regimes from 2000 to 2003 and 2008 saw managed futures managers deliver total returns of 56 percent and 15 percent, respectively. Meanwhile, a persistent risk-on period from 2004 to 2007 saw that same group of managers produce returns of 23 percent.
The reality is that the post-financial crisis timeframe as a whole, as shown in the chart, has been characterized by frequent and unprecedented swings between risk-on and risk-off market environments. We believe the primary catalysts for this back-and- forth since 2009 have been “policy” factors that have resulted in markets often gyrating based upon the whims of politicians rather than underlying economic fundamentals. Excessive swings from “more risky” to “less risky” investments cause a lack of trends across various markets—thus preventing managers from taking advantage of persistent trends in either direction.
Looking Forward: A Post-Whipsaw Era?
The constant back-and-forth between risk-on and risk-off environments has obviously been problematic for managed futures, and trend followers in particular. While we are unsure if a transition to a risk-on or risk-off environment will occur, we think it’s likely that a sustained environment in one direction or the other will soon emerge—which would provide a welcome opening for managed futures managers as trends may begin to develop as a result.
With a sustained upward trend in bond prices (as a result of the extended downward trend in rates), fixed income has served as an important and profitable trend for managed futures managers to capitalize upon. However, a shift to a climate of rising rates, and concurrent downward trend in prices, could offer two significant benefits to managed futures investors as well. The first potential benefit involves managed futures managers’ ability to generate positive potential returns whether the overarching market direction is up or down.
Figure 7 compares managed futures and US stocks’ returns during periods in which bond futures prices fall more sharply from one month to the next (as interest rates are rising). Historically, as rates rose more quickly, managed futures' returns imporved, while US stocks' performance deteriorated.
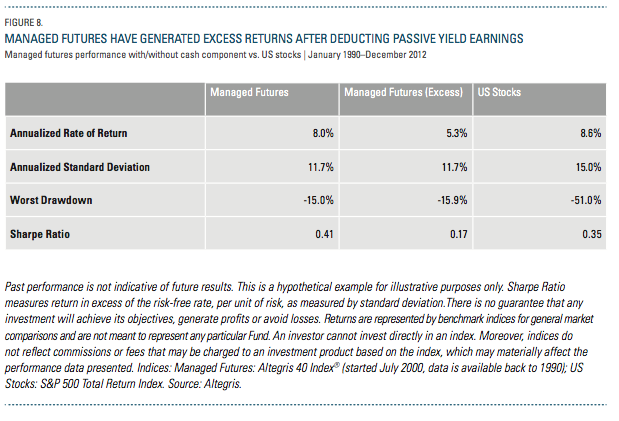
The second attribute of a rising-rate environment involves the yield on the cash collateral of a managed “excess” returns5) are clearly reduced—from 8.0 percent to futures portfolio. For example, a managed futures manager might have to put down 20 percent as collateral for margin requirements with a clearinghouse to gain 100 percent exposure to futures contracts. The 20 percent does not earn any income and is for collateral purposes only. However, the remaining 80 percent is generally invested in 3-month US Treasury bills, which earns the risk-free rate. A higher interest rate, then, means a higher return generated by the cash portion of a managed futures portfolio—which in turn means a higher contribution to the total managed futures return. Of course, the opposite is also true: A lower rate means a lower return from the cash portion of a managed futures portfolio.
The historical impact of the cash portion of a portfolio on managed futures is depicted in Figure 8. Without the cash portion invested in 3-month US T-bills, the returns of managed futures (referred to here asexcess” returns5) are clearly reduced—from 8.0 percent to 5.3 percent on an annualized basis.
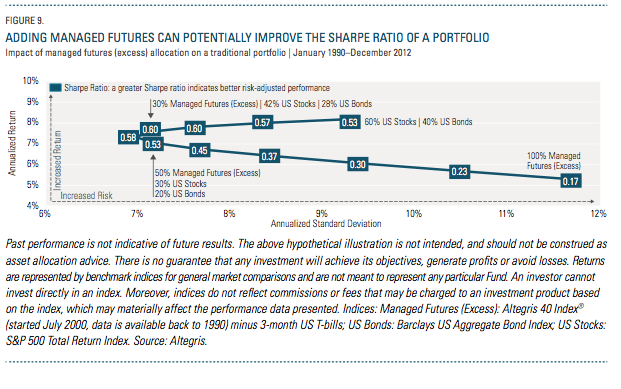
However, managed futures can add value to a traditional long-only portfolio even without the returns generated from cash. To further underscore this premise, Figure 9 represents an efficient
frontier of various hypothetical portfolio allocations to managed futures (excess), US stocks and US bonds. It illustrates that without the cash component earning income, the addition of managed futures to a traditional long-only portfolio provided a hypothetical portfolio with improved risk-adjusted returns (as measured by Sharpe Ratio).
One of managed futures’ most appealing characteristics is their rare ability—in any type of market—to provide returns that are uncorrelated to stocks and bonds.6 If managed futures returns without the enhancements of cash can potentially improve a portfolio due to its non-correlation benefits, what happens when a rising-rate environment once again elevates cash’s role as a return driver?
It’s an enticing—and altogether realistic—scenario, in which managed futures could potentially benefit from additional cash yield while at the same time capitalizing on strong trends.
LookIng Forward: RIsIng Rates, Increased OpportunItIes?
An extended low-interest-rate environment—with rates recently dipping to historic lows—has meant that the cash portion of managed futures has not generated excess returns. But if rates are poised to finally rise, two important consequences of potential benefit to managed futures investors should emerge:
We believe the four themes previously discussed represent the real drivers behind managed futures and the strategy’s recent performance. However, an argument that stubbornly resurfaces as a rationale for managed futures underperformance is that the industry has expanded too rapidly and grown too big, crowding trades and causing a lack of trends across markets.
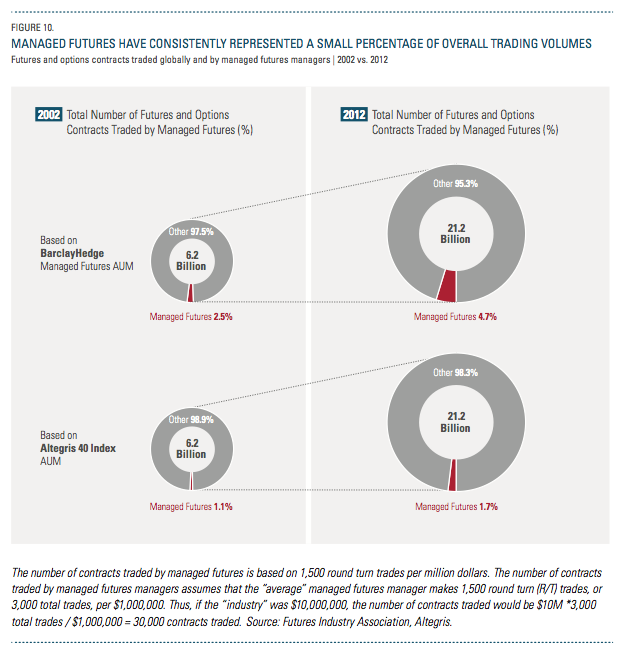
The growth of the managed futures industry over the past decade-plus is unquestioned—the space has expanded more than five times during this period (Figure 10).
The assets under management (AUM) of manager programs included in the Altegris 40 Index increased from approximately $23 billion in 2002 to $121 billion at the end of 2012. Meanwhile, another industry observer, BarclayHedge, estimates managed futures assets rose from $51 billion to
$330 billion during that same time.
We note that BarclayHedge’s figures include Bridgewater Associates, a discretionary global macro hedge fund ($130 billion in AUM), and other hedge fund managers that we believe may overstate the AUM of the managed futures industry and the volume of futures contracts traded. The lines of definition between a managed futures manager and a hedge fund are indeed sometimes blurry, so we don’t fault our friends at BarclayHedge, but for the purpose of considering whether trading volumes are affecting opportunity sets, we prefer to look at a narrower measure of the industry.
Regardless of how managed futures asset growth is quantified, when comparing the number of contracts traded by managed futures managers to the total number of futures and options across the globe, the impact from such growth seems minimal (Figure 10).
The number of futures and options contracts traded globally in 2002 was 6.2 billion. To put that into perspective, we estimate the number of contracts traded by managed futures managers that year was just 2.5 percent (using BarclayHedge AUM) or 1.1 percent (using Altegris 40 AUM) of the total.
Fast forward to 2012, when the total number of futures and options contracts traded globally was nearly 21.2 billion. And yet, the number of contracts traded by managed futures managers during that time was estimated at just 4.7 percent (BarclayHedge) or 1.7 percent (Altegris 40) of the total.
Thus, the number of contracts traded by the managed futures industry has represented—and continues to represent—a relatively small percentage of the overall volume of global futures and options contracts.
If the managed futures space was indeed growing too large, or too quickly, we believe that the percentage compared to the broader universe would be rising more sharply and representing a much larger slice of the total than it does currently. Even if one were to argue that a near-doubling of the value since 2002 (2.5 percent to 4.7 percent, in the case of BarclayHedge’s data) does indeed signal a rapid rise in managed futures trading, it still only constitutes a small portion of all contracts traded today.
According to managed futures manager Salem Abraham, the Founder and President of Abraham Trading Co., skeptics have long been sounding the alarm about the industry’s growth. “For over 25 years, people have always thought there’s too much money in the industry chasing too few trades,” he says. “Yet the market has grown so much bigger. There are so many more opportunities and so much more liquidity now.”
Indeed, the percentage of contracts traded by managed futures managers compared to all futures and options contracts traded globally has remained relatively small over the past 10 years—and we see no reason for that to change dramatically anytime soon.
As a result, we believe that the substantial growth of managed futures investment has not played a significant role in its recent underperformance.
A New Dawn For Managed Futures Investors?
The past few years—particularly 2012—have been undeniably difficult for managed futures. This period has essentially been a “perfect storm” for the space— based on the dearth of trends, amplified volatility compression, whipsawing between risk-on and risk-off market environments, and low interest rates.
Yet, the damage has been minimal, especially when compared to the history of other investments. Over the past 24 months,* managed futures performance is down -7.82 percent. To put that into context, the worst 24-month* period for US stocks produced a negative return of -45 percent.
So perhaps any perceived “crisis” in managed futures currently is not really a crisis at all. In fact, we would suggest that now might actually be a particularly opportune time to invest in managed futures, due to the themes we have discussed—the prospect of strengthening trends, heightened volatility, a more consistent perceived risk environment and rising rates.
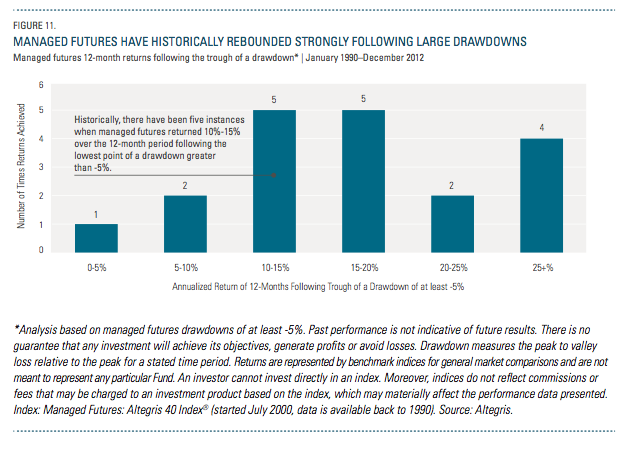
One additional reason for our optimism: Managed futures have historically performed strongly following large drawdowns—just like the recent period of underperformance.
Figure 11 illustrates how managed futures responded one year after the strategy experienced a drawdown of at least -5 percent. What the chart shows is striking: Managed futures delivered returns of at least 15 percent in more than half of the 12-month periods following large drawdowns like the current one. In fact, over the last 23 years, there were four periods in which the strategy generated returns of 25 percent or more over the 12 months following the troughs of these drawdowns.
Q1 2013 Lends Further Support
All of which begs the question: Could we be poised for another such period?
The first quarter of 2013 saw returns of +2.8 percent for the Altegris 40 Index. Compared to the gangbuster gains in stocks, where the S&P 500 was up 10.6 percent and the MSCI World up 7.2 percent, managedfuturesmanagers have been quietly generating positive returns from very diverse positioning in the markets. Most trend managers participated in the equity rally and the yen weakness, while reducing exposure to long positions in fixed income. In general, managers are now positioned cautiously “long” a risk-on position, but maintain substantial hedges to the potential for negative outcomes.
With the Rho Trend Barometer slowly reverting upwards to a level of 45 percent, and the previous 12 months indicating 3 percent volatility expansion compared to the previous year, the Altegris 40 Index has delivered positive returns in four of the past five months through the end of Q1 2013.
We recognize that no one can time a market’s top and bottom perfectly—and those who maintain a long-term allocation to managed futures, in our view, have the opportunity to experience the most complete range of potential benefits offered by the strategy. And yet, we would be remiss if we didn’t at least acknowledge that, after such a challenging period, the simple investment philosophy of “buy
low, sell high” may ring no more true for managed futures than it does today. In that vein, we would echo the view of Stanley Fink, Chairman and CEO of ISAM—and 25-year industry veteran—when he says: “On a historical basis, the darkest hour is often before the dawn—it is after these choppy periods that some amazing trends start to emerge. I believe that we’re potentially at one of these points right now.”
Is The Trend Your Friend?
June 20, 2013
« Previous Article
| Next Article »
Login in order to post a comment