Market meltdowns are the investing world’s equivalent of a merciless tsunami, and when they occur the devastation to portfolios can be ugly. Investors have witnessed two such major market meltdowns since the turn of this century. One occurred between 2000 and 2002, when the S&P 500 index plummeted 49%. The other ran from 2007 to 2009, when the stock market fell 57%.
While many people believe diversification and asset allocation are an effective way to staunch the bloodletting during such events, that hasn’t proved to be the case, says Randy Swan, president and CEO of Swan Global Investments and manager of the Swan Defined Risk Fund. “Since the beginning of time, the industry has been promoting diversification as the solution to risk,” he says. “But history shows it doesn’t work too well in severe market corrections.”
The main reason is the tendency for even seemingly different asset classes to choke together during times of extreme market stress. The performance of target date funds during the most recent bear market illustrates that point. Even though they invested in a mix of stocks and bonds, and were among the most conservatively invested funds at the time, the average fund in the Morningstar Target Date 2000-2010 category lost an average of 31% during the 2007-2008 market correction. It took three full years to recover those losses.
By contrast, the Swan Defined Risk Strategy has kept the bear at bay since Randy Swan first began using it at his Durango, Colo., firm for separately managed accounts 19 years ago. While it leaves room for some upside participation, it shows its strength particularly well in severe bear markets. In 2008, for example, the strategy fell just 4.5% as the market tumbled 37%. Over the long term, it has also captured about 61% of the market’s upside.
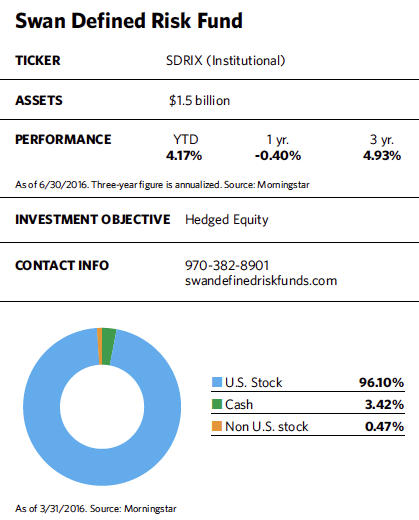
Swan’s strategy is based on options strategies designed to control risk while also giving investors a shot at reward. The rules-based process starts with the S&P 500, which Swan taps through nine equally weighted ETFs that represent each sector of the index, and he remains invested in these at all times. In an attempt to limit portfolio losses, the fund then purchases long-dated put options (which are at or near the money) on the ETFs. (These give a buyer the right to sell assets by a particular date at a stated price.)
The long-dated options are purchased every year, usually toward the end. In addition, the fund also tries to generate income and reduce risk by selling short-term puts and calls.
Unlike many of his peers who use options in their strategies, Swan doesn’t try to time the market or bet on specific company stocks. “Our system is not based on market timing predictions or judgments about particular companies,” he says. “We take a rules-based approach, and that separates us from tactical or long/short managers.”
The technique sets parameters for how much the fund can lose, or gain, in a given year. If Swan sets a downside limit of 8%, for example, he invests the fund to lose no more than about that amount even in a worst-case scenario.
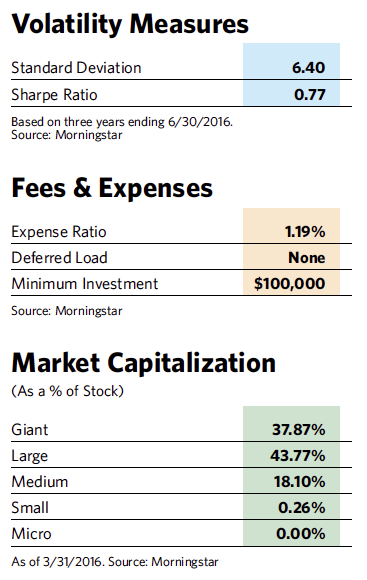
But the approach also limits upside potential in bull markets. From the fund’s inception in 2012, its institutional class shares have had an average annualized return of 4.36% through March 2016, while the S&P 500 returned 12.9% during the same period. Volatility poses a challenge, however. In turbulent 2015, for instance, the fund’s institutional shares fell 4.3% while the S&P 500 rose 1.4%.
Swan sees the fund as a kind of insurance against disaster. “Our approach is about providing true bear market protection, as opposed to the 5% or 10% corrections we’ve seen in recent years,” he says.
Over the longer term, he says, his ability to limit losses when the market tanks has been a powerful and positive driver of returns. Swan Global Investments has been using the same strategy employed by the fund since 1997 for separately managed accounts. According to the firm, a $100,000 investment in the Swan Defined Risk Strategy between 1997 and March 2016 would have grown to $459,215 (net of fees), while the same investment in the S&P 500 would have grown to $329,743 and would have grown to $324,306 in a 60/40 portfolio of stocks and bonds. On an annualized basis, that translates into an 8.47% return for the Swan strategy, a 6.57% return for the index and a 6.48% return for the balanced portfolio.