


2. Because the withdrawal rate is driven by the inflation rate, during periods of high inflation, spending amounts may increase too rapidly, placing the portfolio at risk of premature depletion.
To understand how a lifestyle spending policy works, it’s helpful to look at a hypothetical client’s situation. For this example, let’s assume you have a client who has a $1 million portfolio and wants to begin taking distributions of 5 percent from her portfolio on January 1, 1973. During this period of high inflation (which averaged 8.75 percent), your client’s spending amount doubled from $50,000 to $108,632 (figure 1).
If it seems unfair to begin with the 1973 period, which was arguably one of the toughest investment periods in the last 80 years, let’s look at how the lifestyle spending approach worked during a more moderate investment environment that began in 2000. In figure 2, the blue line shows the lifestyle spending rate from 1973 to 1985, a period during which inflation rose from 6.16 percent in 1973 to a high of 13.58 percent in 1980 and then declined to 3.55 percent in 1985.
As you can see, in this case, the lifestyle spending approach creates a problem because the amount being spent increases every year, because there is no relationship between the value of the underlying portfolio and the spending amount.
For this client, high inflation was only half the story. During this period stock prices fell dramatically as the S&P 500 declined by approximately 37 percent between 1973 and 1974. The combination of high inflation and the stock market losses caused this client’s investment portfolio to last just 21.5 years (figure 5). 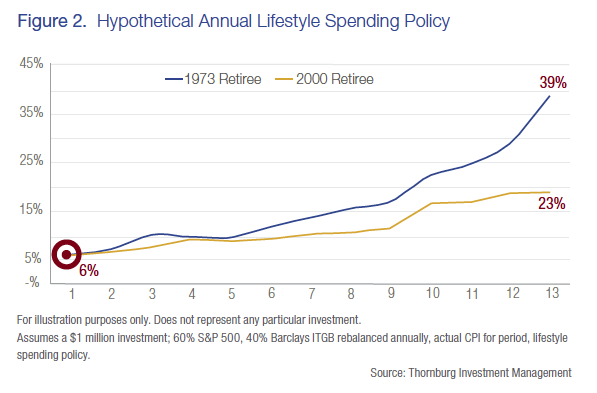
The gold line illustrates the spending rate beginning in 2000 when the rate of inflation was 2.19 percent and ending in 2013 when the rate of inflation was 2.07 percent.
The client who began taking portfolio distributions in 2000 doesn’t have the same issue as the client who began taking distributions in 1973, because during the 2000s inflation was lower and grew at a much slower rate than it did during the late 1970s and early 1980s. Still, the downside of the lifestyle spending approach is underscored in figure 2 by the fact that by the end of 14 years, the withdrawals, when expressed as a percentage of the portfolio of your 1973 client, had increased to 39 percent, while the client who began taking portfolio distributions in 2000 was withdrawing 23 percent of their portfolio. Looking at the chart it is obvious that both rates are at odds with the client’s goal of building a sustainable portfolio.
So, if the lifestyle spending policy isn’t the way to go, what approach should you take to help your clients balance their cash flow needs with inflation, market fluctuation and the desire to extend the longevity of their investment portfolios? Consider an Endowment Spending Policy.