


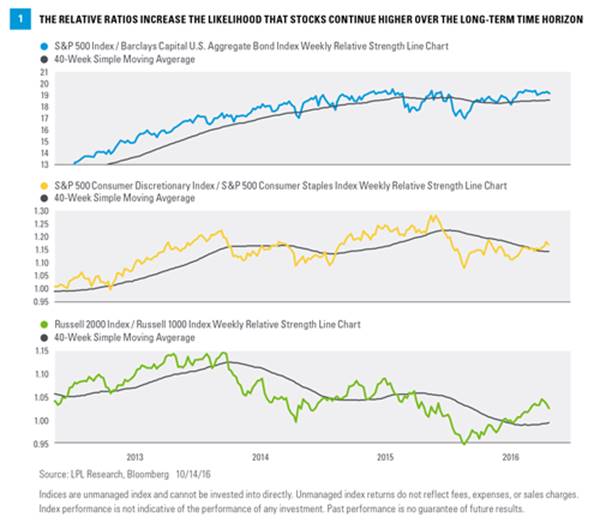
· Consumer discretionary versus consumer staples. When the consumer discretionary index outperforms the consumer staples index, it indicates that the market favors goods that consumers choose to buy (i.e., discretionary) over items that they must buy (i.e., staples). This is evidence of the market’s confidence in consumer spending, and the economy as a whole.
Looking at historical data going back to 2003, when the weekly reading on the S&P 500 Consumer Discretionary Index / S&P 500 Consumer Staples Index relative strength line chart is sustained above its 40-week SMA for three trading weeks, the S&P 500 index has tended to rise over the long term. Since 2003, this type of moving average crossover happened only 14 times. Six months later, the S&P 500 was higher 10 of 14 times (71%), with average total returns of 6.5%. Going out nine months, returns were positive 12 of 14 times (86%), with average total returns of 10.5%. Looking out one year, the returns were positive 11 of 14 times (79%), with average total returns of 10.5%.
· Small caps versus large caps. When the small cap index outperforms the large cap index, it can be reflective of a growing stock market due to the increased investment into small business.
Looking at historical data going back to 2003, when the weekly reading on the Russell 2000 Index / Russell 1000 Index relative strength line chart is sustained above its 40-week SMA for three trading weeks, subsequent long term price levels on the S&P 500 index tended to rise. Since 2003, this type of moving average crossover happened only 13 times. Six months later, the S&P 500 was higher 8 of 13 times (61%), with average total returns of 2.5%. Going out nine months, returns were positive 11 of 13 times (85%), with average total returns of 5.5%. Looking out one year, returns were positive 10 of 13 times (77%), with average total returns of 9.1%.
Bullish Combination
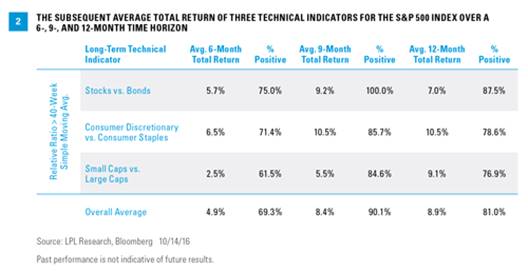
The combination of the three aforementioned technical indicators increases the likelihood that stocks will move higher over the next six to 12 months. Taking an overall average of the indicators, six months later, the S&P 500 was higher 69% of the time, with an average total return of 4.9%. Going out nine months, returns were positive 90% of the time, with average and median returns of 8.4%. Looking out one year, the returns were positive 81% of the time, with average and median total returns of 8.9% [Figure 2].
Investor Sentiment
We also find value in assessing investor sentiment. History has shown that the crowd can be right during trends, but tends to be wrong at extremes. Sentiment can be used as a contrarian indicator, because if everyone who might become bearish has already sold, only buyers are left. This, of course, applies to the reverse as well.
Sentiment polls are one way to gauge investor sentiment, and so far this year we’ve seen an unusually high level of fear. For instance, the American Association of Individual Investors (AAII) Sentiment Poll has seen the percentage of bulls below 30% for eight consecutive weeks. That is the second longest such streak in 22 years. Additionally, going back to 1987 when the weekly poll started, the average number of bulls has been 38.5%. Incredibly, the bulls have come in below this number for a record 49 straight weeks, trouncing the previous record of 33 straight weeks.
Fund Flows