


We could have said, “I expect 3.10% from my stock portfolio and 5.07% from my bond portfolio”. The math on expectations of a 70/30 portfolio would have been: .70%*3.10% + .30%*5.07% = 3.69%.
Note that the diversification return is generally smaller for shorter time periods, so we would add in 0.30% for diversification return (0.30% was the median diversification return for a 70/30 portfolio over 10-year periods as of 12/31/2001). We could have expected 3.99% average annual returns. Over the next decade, the returns of a 70/30 portfolio were 4.96%, or pretty close to expectations and certainly far under the long term returns of the 70/30 portfolio (which had been 11.36% at that time!). Anyone expecting to obtain the average long-term returns would have been badly disappointed.
Below we can see the complete historical data set since 1970. This indicates what led to the expectations for a 70/30 portfolio for each year since 1970. The far right column shows how far off the expectations were from the actual experience.
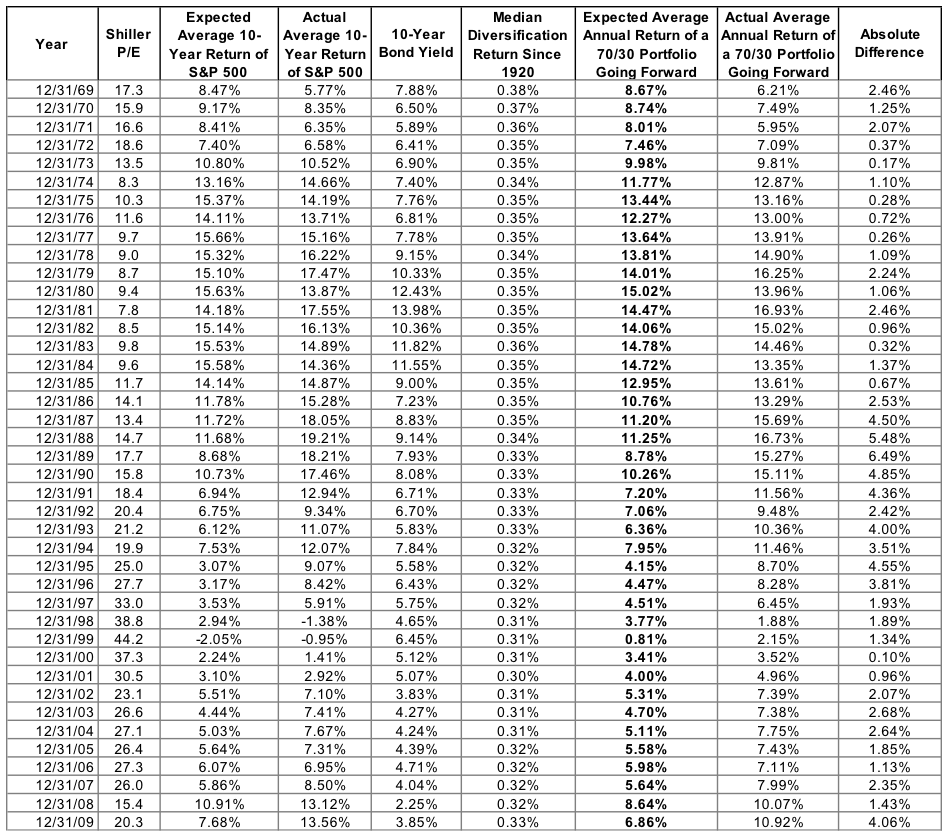
Expected returns have been between 1% and 15% while actual returns have been between 2% and 17%. Over a decade, returns face an uncomfortably wide range of outcomes, and that range depends almost entirely on starting valuation. Note that 76% of the time, expected returns fell within 3% of actual returns. Further, the times where results were off by more than 3% were all associated with the outperformance due to the internet bubble and the period ending 2019 (the longest bull market on record).
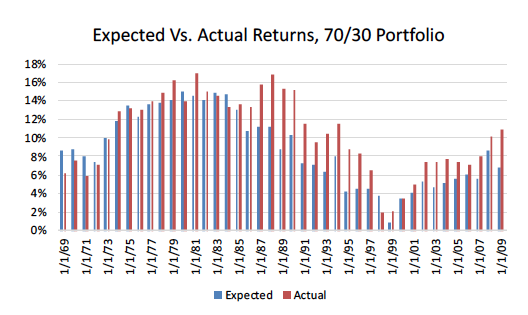
To better show the data, below is a graph of the expected and actual returns going forward, by year. The data is over 85% correlated.
Where We Are Today
Starting this year the 10-year U.S. government bond was yielding 1.92%. The Shiller P/E of 31 is almost 2 standard deviations above median. This valuation implies 3.55% average annual returns going forward for U.S. equities. Today the math on expectations of a 70/30 portfolio should be: .70%*3.55% + .30%*1.92% = 3.06%.
Add in 0.35% for diversification return (the long-term average, as of today), and expectations should be 3.41% for a U.S. 70/30 portfolio going forward. Using the same methodology, the Shiller P/E forecast for average annual returns over the next seven years is an even more disappointing 1.80%.
3.41% is likely not enough for most investors, especially considering that after deducting inflation the real return is even lower. So, what can we do? Diversify.