


After a brief lull in 2023, buyback activity appears to be back this year. A resilient U.S. economy, easing inflation pressures and expectations for an eventual shift to interest rate cuts have given corporate America confidence to boost authorized share repurchases. These companies have a history of outperforming the broader market and tend to have more exposure to momentum, value and growth factors. While buybacks also reduce share count and help support earnings growth and valuations, they can also help limit downside volatility during periods of selling pressure.
Buyback Backdrop
Buybacks, also referred to as share repurchases, are when a company elects to purchase its own shares in the open market. They are typically announced as a ‘share repurchase authorization’ and are bound by a maximum dollar amount or share amount the company can repurchase. And while most share repurchase programs are executed, they don’t necessarily have to be, as management maintains discretion over when or if the company buys back its shares.
Buyback activity has made a comeback after most companies suspended share repurchase programs in the wake of the pandemic. For example, total S&P 500 buybacks jumped from $525 billion in 2020 to $930 billion in 2022. However, buybacks tapered off last year to $782 billion as economic uncertainty and higher interest rates pushed repurchases to the sidelines. (Higher rates made leveraged buybacks—when companies issue debt to buy back shares—less attractive.)
With the economy continuing to show signs of resilience and inflation moving in the right direction, albeit at a slower and bumpier trajectory than expected, buybacks are expected to rebound again in 2024. According to S&P Dow Jones Indices, S&P 500 companies are expected to repurchase $885 billion in stock this year. So far, companies are off to a solid start with $155 billion in announced repurchases year to date, including a notable $50 billion share repurchase program from Meta (META).
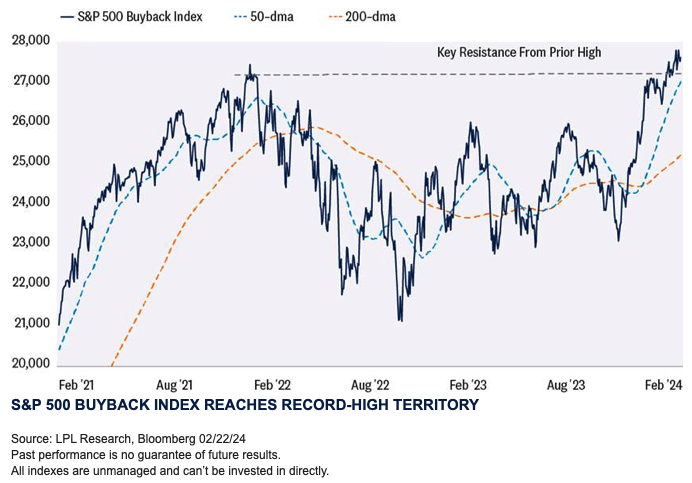
While there is a lot of debate over the utilization and value of share buyback programs (which we are not going to delve into here), the market has typically rewarded companies that buy back stock. This year, the S&P 500 Buyback Index is up 3.5% as of February 22 and is back in record-high territory after surpassing its 2022 highs. Both trend and momentum indicators suggest this rally has more room to run. For reference, the S&P 500 Buyback Index represents an equally weighted and quarterly rebalanced basket of the top 100 stocks with the highest buyback ratio (cash paid for common shares during the last four calendar quarters divided by the total market capitalization of common shares).
Buybacks Historically Outperform
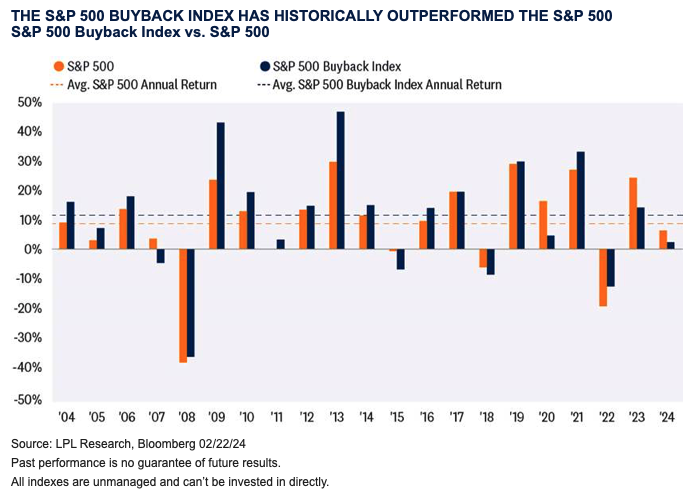
While the S&P 500 Buyback Index is underperforming the broader S&P 500 by about 3% year to date, history suggests it could have some catching up to do. Over the last 20 years, the S&P 500 Buyback Index has beaten the S&P 500 71% of the time, amassing an average annual return of 11%. This compares to the S&P 500’s average annual return of 8.9% over the same period.
A Closer Look Under The Hood
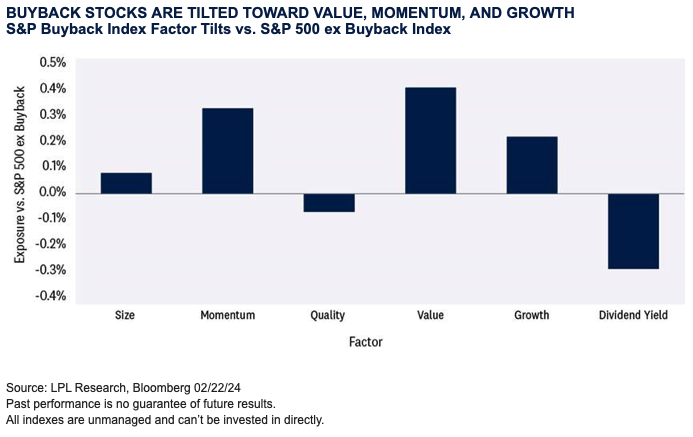
As noted in the S&P 500 Buyback Index vs. S&P 500 chart, companies with high buyback ratios have historically performed quite well. However, it is not just share repurchases that drive outperformance, as many of these companies have more unique fundamental factors that can separate them from non-buyback companies. This chart highlights these fundamental tilts on more of an equal playing field by comparing factor exposure between the S&P 500 Buyback Index to an Equal Weight S&P 500 ex Buyback Index (excludes the companies in the buyback index). When the exposure score is positive, it implies the S&P 500 Buyback Index has more exposure to the factors listed below. For example, the S&P 500 Buyback Index has much more exposure to value, momentum and growth relative to the S&P 500 ex Buyback Index. Among those factors, buyback companies stick out compared to non-buyback companies with typically higher earnings yield, earnings and sales growth, and profitability.
What About The Magnificent Seven
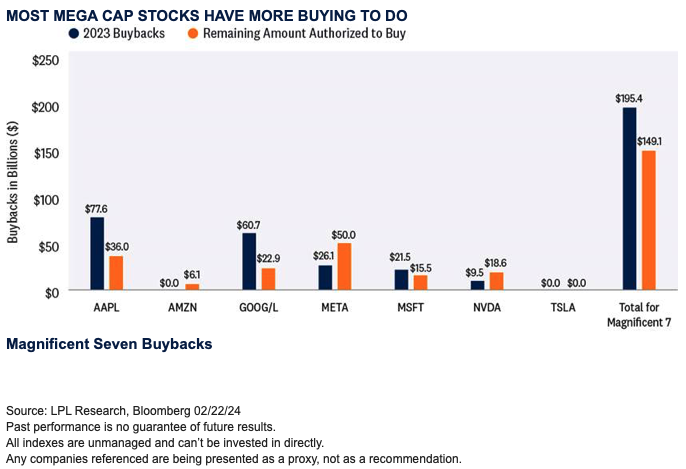
It is nearly impossible to have any market-related discussion without mentioning the Magnificent Seven, comprised of Alphabet (GOOG/L), Amazon (AMZN), Apple (AAPL), Meta (META), Microsoft (MSFT), NVIDIA (NVDA) and Tesla (TSLA). While these mega-caps have contributed to the majority of the S&P 500’s year-to-date gain and are solely responsible for lifting the index’s fourth quarter earnings into positive territory, most also have sizable buyback programs in place to support their stock. As illustrated in the “Magnificent Seven Buyback” chart, total buybacks for the group in 2023 totaled just over $195 billion, with AAPL and GOOG/L representing the lion’s share. Looking ahead to 2024, it could be another sizable year of share repurchases as the group still has $149 billion penciled in for buybacks.
Conclusion
This year, buyback activity appears to be back in action as inflationary pressures subside and the Federal Reserve (Fed) gets closer to transitioning from rate hikes to rate cuts. Economic activity and earnings are also improving. While Treasury yields have recently moved higher due to the repricing of Fed rate cuts further out on the calendar, higher rates have not eroded confidence in the potential for a soft-landing scenario. This backdrop, coupled with what LPL Research believes is limited upside risk to rates, has renewed confidence in corporate America to roll out sizable buyback programs. While buybacks reduce share count and help support earnings growth and valuations, they can also help limit downside volatility in the event of selling pressure.
Adam Turnquist, CMT, is chief technical strategist at LPL Financial.