It has long been known that many investors, especially those using a cash flow approach to spending, have a preference for cash dividends. From the perspective of classical financial theory, this behavior is an anomaly. In their 1961 paper, “Dividend Policy, Growth, and the Valuation of Shares,” Merton Miller and Franco Modigliani famously established that dividend policy should be irrelevant to stock returns. As they explained, at least before frictions like trading costs and taxes, investors should be indifferent to $1 in the form of a dividend (causing the stock price to drop by $1) and $1 received by selling shares. This must be true unless you believe that $1 isn’t worth $1. This theorem has not been challenged since, at least in the academic community.
That is why there are no asset pricing models that include dividends as an explanatory factor in the cross-section of stock returns. The leading models include market beta, size, value, momentum, profitability and investment, but not dividends. Quality (betting against beta) is another factor that has been shown to have a premium that has been persistent, pervasive, robust and implementable. The traits of quality companies are low earnings volatility, high margins, high asset turnover, low financial leverage, low operating leverage and low stock-specific risk.
Despite having not been found to be an explanatory factor, a large, passionate, vocal community of investors strongly favor dividend-paying stocks, partly because they consider dividends as income, when they are not. Simply put, income increases your net worth, while dividends do not (the value of the company falls by the amount of the dividend). Instead of being income (except for tax purposes), they are simply a way for companies to return investor capital (versus a share buyback). And for taxable investors it’s an inefficient way to return capital, as taxes must be paid on the dividend.
With that said, the fact is that high-dividend-paying stocks and growing-dividend stocks have outperformed the overall market, which helps explain the preference. However, the reason that dividends are not in any asset pricing model is that the research has found that it is not the dividends that matter in explaining returns, but the other traits of the dividend payers. For example, high-dividend-paying stocks tend to be value stocks, but using price-to-dividends produces the weakest value premium—price to other metrics such as earnings, cash flow and sales all produce higher value premiums.
Latest Research
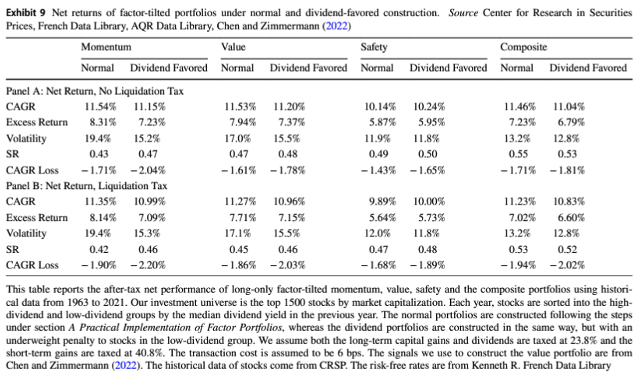
To investigate if dividends are themselves economically informative or just provide a signal, Yin Chen and Roni Israelov, authors of the study “Income Illusions: Challenging the High Yield Stock Narrative,” published in the March 2024 issue of the Journal of Asset Management, split stocks in their eligible universe into high-dividend and low-dividend groups (50% of stocks in each group) by their median dividend yield in the previous year and analyzed the impact of dividends on investment returns under two different settings. In the first setting, they compared the performance of the two different groups and tested if the high-dividend group has historically outperformed the low-dividend group. In the second setting, they applied a dividend-based portfolio adjustment to a few long-only factor portfolios to test the hypothesis that investors can benefit from restricting their selection of factor winners among high-dividend groups. Specifically, they penalized the target weight of low-dividend stocks in the portfolio regardless of their factor scores. If low-dividend stocks predicted lower future returns in the factor portfolio, they would expect to see stronger performance under the new construction.
The factors they analyzed were market beta, size, value, profitability, investment (Ken French Data Library) and momentum and quality (AQR Data Library). Their sample covered the period January 1964-December 2021 (data from CRSP) and included the top 1,500 U.S. stocks. Following is a summary of their key findings:
The high-dividend portfolio dominated in both return and risk. It realized a 13.8% average annual return with 15.6% volatility. In comparison, the low-dividend portfolio realized lower returns (11.8%) with much higher volatility (21.9%). The higher return and lower volatility resulted in a 3.6% difference in compound annual growth rate. The high-dividend portfolio also had smaller drawdowns during market corrections.
Despite the high-dividend stocks’ outperformance in the full sample, investment in a long-short portfolio lost close to 1% per year between 2003 and 2021—the last 19 years of the sample. Most of the positive returns came from the middle 20-year period from 1983 to 2002.
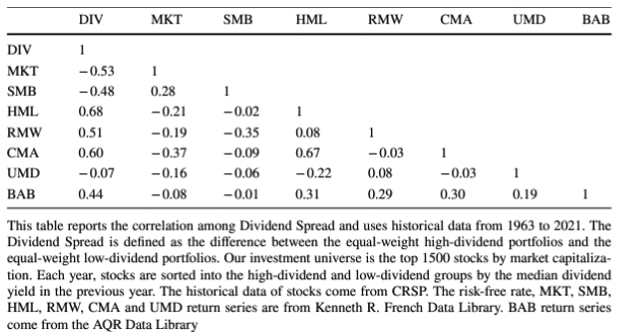
The dividend spread had a negative correlation with the market beta (-0.53) and size factors (-0.48), suggesting the high-dividend portfolio contained larger stocks with smaller market betas compared to those in the low-dividend portfolio. The spread was also positively correlated to the value (0.68), profitability (0.51), betting-against-beta (quality) factor (0.44) and investment factors (0.60). There was also a small negative correlation with momentum (-0.07). Thus, stocks without dividends tended to be growth stocks with lower profitability and more aggressive investment—stocks with those characteristics have underperformed the market.
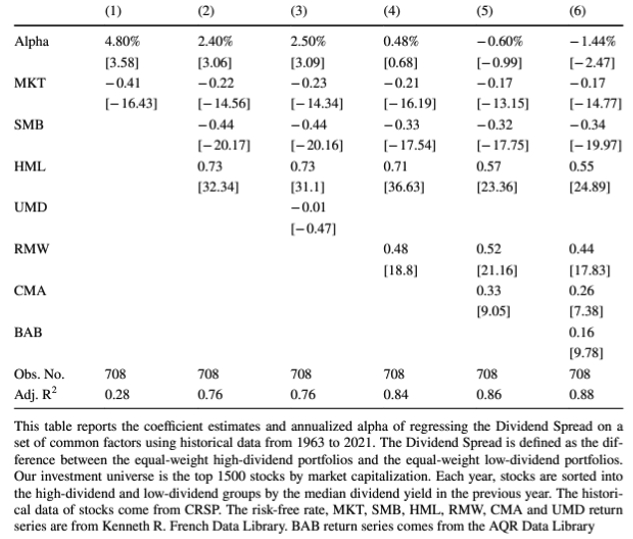
Consistent with financial theory and prior research, while the high-dividend group delivered higher returns than the low-dividend group, the outperformance was entirely explained by a set of common quantitative factors—after controlling for value, quality and defensive factors, the excess return of high-dividend over low-dividend turned negative. Against the single factor CAPM, the dividend spread portfolio produced a statistically significant alpha of 4.8% (perhaps explaining the popularity). Against the Fama-French three-factor model, the alpha was still an impressive 2.4%, and the explanatory power almost tripled: The R-squared increased from 0.28 to 0.76. Including momentum had almost no impact. Including profitability increased the R-squared to 0.84 and reduced the alpha to a statistically insignificant 0.48%. Including all five Fama-French factors further increased the R-squared to 0.86, while the alpha changed to a statistically insignificant -0.60%. And including the betting-against-beta factor further reduced the alpha to a statistically significant -1.44%.