Don’t worry about the January Barometer, which says, “As goes January, so goes the year.” Here we discuss the reliability of this indicator and several factors that may lead to better performance in February. We see opportunities in the stock market in 2016, but suggest caution in the near term as we await clarity on the key issues pressuring investor sentiment.
JANUARY BAROMETER
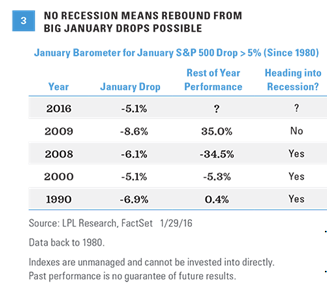
The widely followed January Barometer says, “As goes January, so goes the year.” In other words, if the S&P 500 is positive in January, stocks are likely to rise over the rest of the year; and conversely, if January is in the red, then the rest of the year will also be weak. With the S&P 500 down 5.1% in January, after being down as much as 9% for the month as of January 20, 2016, this indicator will likely get a lot of press over the next few days. Looking at the data does show the final 11 months of a calendar year tend to take a cue from January. Since 1950, January has been higher 40 times; and in those years, the average return the rest of the year has been 12% with additional gains posted 88% of the time. When January has been negative, the rest of the year has been flat on average but still posted gains 58% of the time [Figure 1].
Recently though, this indicator hasn’t worked very well. The last four times the S&P 500 fell in January, stocks rose the rest of the year. In 2009, 2010, 2014, and 2015, the S&P 500 was red in January and each year saw a bounce back, by 35%, 17%, 15%, and 2%, respectively. Since 2005, the only year to see a decline after a January drop was 2008, the start of the financial crisis and Great Recession. Given we do not think the economy is headed for a recession this year, we maintain our base case view that stocks are likely to end 2016 higher than where they closed on Friday [Figure 2].
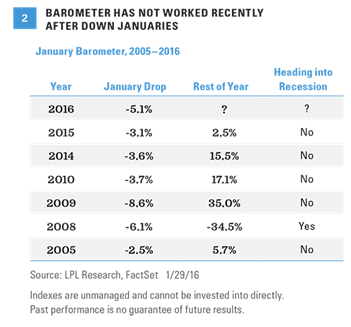
What about when January is down big (5% or more), like what occurred in January 2016? Again, distinguishing recessionary periods provides useful perspective. Looking at all years since 1980, when the economy was in a recession, the rest of the year was weak for stocks after a down January. When the economy was not in recession or emerging from one, as was the case in 2009, the rest of the year saw a big rally [Figure 3]. We are not suggesting 2016 is like 2009, but the economic environments in 1990, 2000, and 2008 bear little resemblance to 2016, suggesting to us that the backdrop for stocks is more supportive today.
PERSPECTIVE ON VOLATILITY
Unfortunately, this volatility may stay with us, given we are late in the economic cycle and the complex nature of the biggest factors weighing on investor sentiment. However, with the VIX measure of implied stock market volatility in-line with its long-term average at 20, and the maximum drawdown in the S&P 500 so far this year at 12%, we would continue to characterize the volatility we have seen thus far in 2016 as within a normal range.
KEYS TO A BETTER FEBRUARY
After last week’s bounce and two straight weeks of gains for the S&P 500, it is very tempting to wave the “all clear” flag. We have cited a number of positives for this market that may help drive a turnaround for stocks in the coming month, including: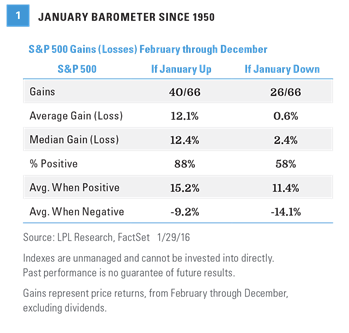
Not only were stocks down in January, but the month also brought significant volatility. In fact, 2016 saw the worst 10-day start to a year ever for the S&P 500, although stocks did manage gains during each of the last two weeks of January. In the end, 13 trading days out of 19 saw a 1% move (higher or lower), the most since October 2011 [Figure 4]. On a percentage basis, 68% of the days moved at least 1%. Since 2010, only May 2010 and October 2011 saw more daily volatility.