


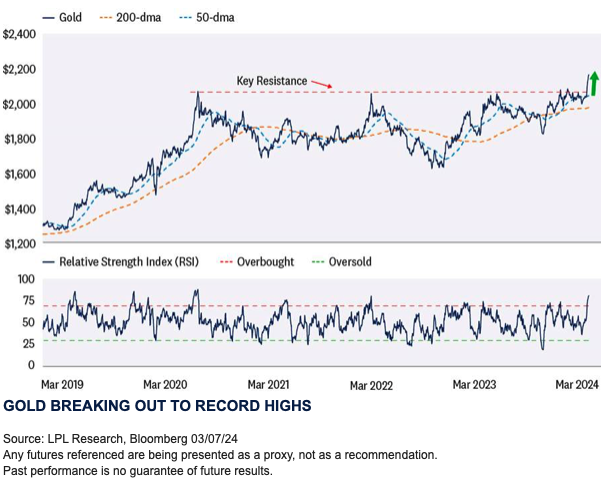
Bullion broke new ground last week after rallying to a record high. Growing investor confidence for a Federal Reserve (Fed) rate cut by this summer dragged down yields and the dollar, creating a tailwind for gold. The breakout above key resistance at $2,075 was also a major technical development, confirmed by bullish momentum that suggests the rally could continue. Global central bank demand has been another key catalyst and has shown no sign of slowing down, while a rebound in demand from gold-related exchange-traded funds (ETFs) could provide additional support for the yellow metal.
Gilded Gains
In a market enthralled by mega cap performance and artificial intelligence, the ancient-old gold trade managed to steal some of the spotlight last week as the yellow metal rallied to new highs. The path to record-high territory has been a long one, mired by inflation and fixed income market volatility, drastic fiscal and monetary policy changes, and a host of geopolitical surprises, but after three-and-a-half years, gold finally surpassed its August 2020 high near $2,075.
New highs are almost immediately followed by the question of “How high can prices go?” Technical analysis provides a framework for answering this question. Gold’s rally to new highs was preceded by a breakout from what is called a “bullish flag formation”—a chart pattern characterized by a temporary consolidation in a strong uptrend. Breakouts to the upside of these formations imply a resumption of the uptrend, and for gold, point to a minimum technical-based price objective near the $2,250–$2,350 range.
Momentum indicators suggest gold could get there. The Relative Strength Index (RSI)—a momentum oscillator used to measure the velocity of price action to determine trend strength—has climbed into overbought territory. While overbought may sound alarming, technical analysis views overbought readings that accompany breakouts as a confirmation of trend strength. Furthermore, RSI has yet to reach extreme levels commensurate with prior pullbacks.
Stocks And Gold Both Making New Highs?
Gold is widely considered as a store of value that can help hedge inflation risk and diversify a portfolio. During periods of elevated market volatility and heightened geopolitical risk, gold also serves as a safe haven asset. These characteristics helped shape the Wall Street adage of “hold gold and hope it doesn’t go up.”
Price action in gold over the last six months has been a bit paradoxical when considering the market backdrop of receding inflation and aggressive risk-on positioning. However, as investors have become more confident in the Fed’s transition from rate hikes to rate cuts, gold has done very well. Like most decisions in investing, it is all relative, so as interest rates moved lower on the back of a potential Fed policy pivot, both nominal and real yields became less attractive relative to gold, which offers no yield. Furthermore, the dollar has followed interest rates lower, providing another tailwind for the precious metal.
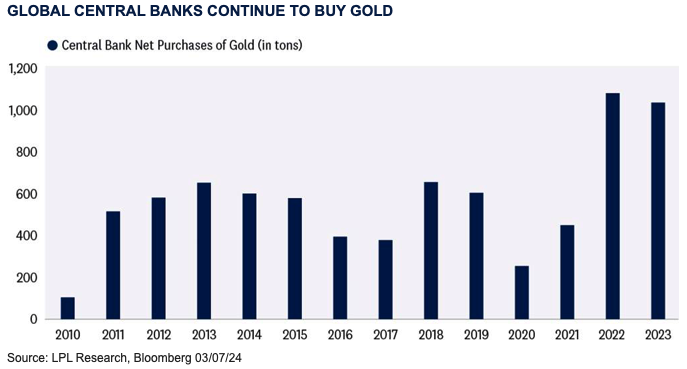
While a weaker dollar and falling interest rates are a big part of the gold-rally narrative, global central banks are another part of the story. Over the last few years, gold demand among central banks has notably accelerated, including record-setting net purchases of gold in 2022 and near-record-level buying in 2023. The jump in demand is attributable to foreign central banks diversifying away from dollar reserves, partially due to concerns over ballooning U.S. deficits, but likely more due to concerns over reserve assets being seized by the U.S. government, as was the case for Russia following their invasion of Ukraine in 2022. Confidence in the latter is supported by China’s central bank adding to their gold reserves for 16 straight months after being inactive in the market since 2019.
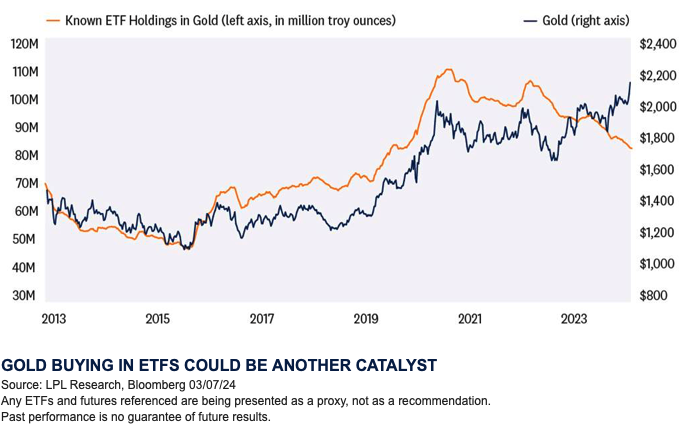
In addition to a bullish technical setup, a constructive macro backdrop, and robust central bank buying, gold could see a rebound in demand from ETFs. Historically, the price of gold and physical gold holdings in ETFs are positively correlated, but more recently, gold prices and gold ETF holdings have notably deviated—providing more evidence of the impact central bank demand has had on gold. However, with gold breaking out to new highs and creating lots of headlines along the way, inflows into gold-related ETFs could be due for a rebound as the fear of missing out trade kicks in. History supports this thesis, as peaks in gold ETF holdings occurred after gold prices peaked in 2020, 2021, and mid-2023.
Conclusion
The recent rally in gold does not appear to be just another flash in the pan. Gold’s breakout above key resistance at $2,075 was a major technical development, confirmed by bullish momentum and price patterns. Macro conditions remain supportive for gold, including elevated geopolitical tensions, receding yields and a weaker dollar. The transition to Fed interest rate cuts could provide an additional catalyst for gold. Global central bank demand remains another key factor to gold’s rally and has shown little signs of slowing down. The deviation between gold prices and gold holdings in ETFs appears stretched, raising the probability of a potential rebound in demand from gold-related ETFs.
While gold is overbought, it does not mean the rally is over, as overbought conditions can persist for meaningful periods. In the event of a pullback, watch for support to develop near the prior highs at $2,075. Also, keep an eye on the materials sector, which has gold-related exposure via the mining space.
Adam Turnquist is chief technical strategist for LPL Financial.