


Empirical Evidence On The Counter-Productiveness Of QE And Forward Guidance
Since the introduction of unconventional and untested monetary policy operations like quantitative easing (QE) and forward guidance, an impressive amount of empirical evidence has emerged that casts considerable doubt on their efficacy. The historical facts regarding the grand experiment by the Federal Reserve Open Market Committee (Fed) are worth considering.
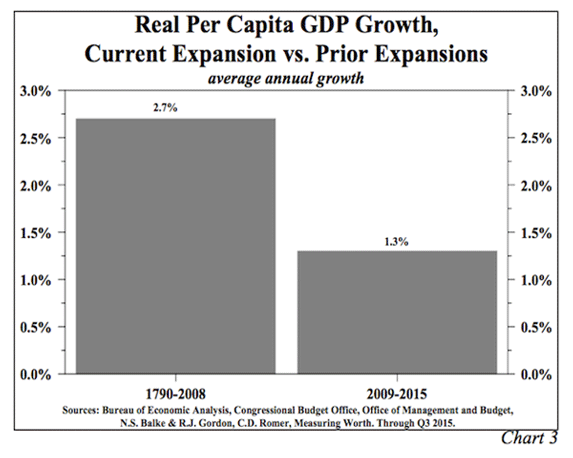
The trend in economic growth in this expansion has been undeniably weak and perhaps unprecedentedly so. Real per capita GDP grew only 1.3% in the current expansion that began in mid-2009; this is less than one half the growth rate in the expansions since 1790 (Chart 3).
Based on their theoretical expectations of QE, the Fed and multilateral economic agencies (such as the International Monetary Fund) constantly projected that economic growth would accelerate significantly and that inflation would return to the 2% level targeted in the Fed’s dual mandate. These forecasts widely and consistently over-estimated both real growth and inflation.
The study “Persistent Overoptimism About Economic Growth” by Kevin J. Lansing and Benjamin Pyle and published in the Federal Reserve Bank of San Francisco Economic Letter of February 2, 2015 systematically examined the Fed’s forecasting record. Specifically, Lansing and Pyle examined the real GDP projections made four times per year by the Fed that began in November 2007. Their overall conclusion reads: “Since 2007, Federal Open Market Committee participants have been persistently too optimistic about future U.S. economic growth. Real GDP growth forecasts have typically started high, but then are revised down over time as the incoming data continue to disappoint.” Even Mrs. Yellen in her December press conference admitted the Fed’s models were not working.
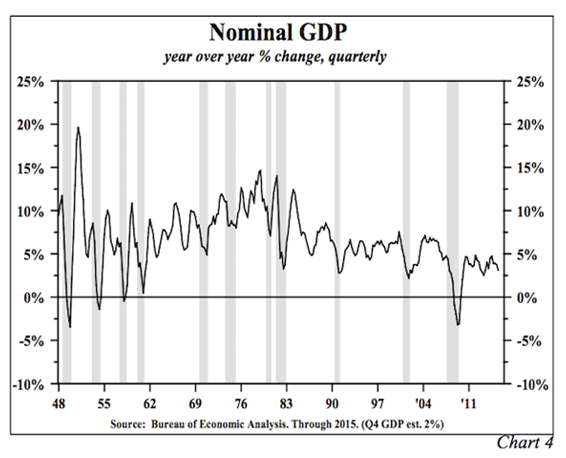
Central banks in Japan, the U.S. and Europe tried multiple rounds of QE. That none of these programs were any more successful than their predecessors also points to empirical evidenced failure. The pattern is shown in year-over-year growth in U.S. nominal GDP (Chart 4). Three weak transitory mini growth spurts all reversed, and the best rate of growth in the current expansion was weaker than the peak levels in all of the post 1948 expansions.
Several academicians have found that the data does not validate the efficacy of QE and forward guidance. In a paper presented at the Fed’s 2013 Jackson Hole Conference, Robert Hall of Stanford University and Chair of the National Bureau of Economic Research Cycle Dating Committee wrote “an expansion of reserves contracts the economy.”
Negative interest rates would have the same non-productive characteristics as QE and forward guidance.
A Causal Mechanism Explaining The Counter-Productiveness O fQE And Forward Guidance
This empirical data notwithstanding, a causal explanation of why QE and forward guidance should have had negative consequences was lacking. This void has now been addressed by “Where Did the Growth Go?” by Michael Spence (2001 recipient of the Nobel Prize in economics) and Kevin M. Warsh (former Governor of the Federal Reserve), a chapter in a new book Growing Global: Lessons for the New Enterprise, published in November 2015 by The Center for Global Enterprise.
The Spence and Warsh point is that the “the post-crisis policy response” contributed to and helps to explain the slower economic growth during the past several years. Their line of reasoning is that the adverse impact of monetary policy on economic growth resulted from the impact on business investment in plant and equipment. Here is their causal argument: “...QE is unlike the normal conduct of monetary policy. It appears to be qualitatively and quantitatively different. In our judgment, QE may well redirect flows from the real economy to financial assets differently than the normal conduct of monetary policy.” In particular, they state: “We believe the novel, long-term use of extraordinary monetary policy systematically biases decision-makers toward financial assets and away from real assets.”
Quantitative easing and zero interest rates shifted capital from the real domestic economy to financial assets at home and abroad due to four considerations:
First, financial assets can be short-lived, in the sense that share buybacks and other financial transactions can be curtailed easily and at any time. CEOs cannot be certain about the consequences of unwinding QE on the real economy. The resulting risk aversion translates to a preference for shorter-term commitments, such as financial assets.
Second, financial assets are more liquid. In a financial crisis, capital equipment and other real assets are extremely illiquid. Financial assets can be sold if survivability is at stake, and as is often said, “illiquidity can be fatal.”
Third, QE “in effect if not by design” reduces volatility of financial markets but not the volatility of real asset prices. Like 2007, actual macro risk may be the highest when market measures of volatility are the lowest. “Thus financial assets tend to outperform real assets because market volatility is lower than real economic volatility.”
Fourth, QE works by a “signaling effect” rather than by any actual policy operations. Event studies show QE is viewed positively, while the removal of QE is viewed negatively. Thus, market participants believe QE puts a floor under financial asset prices. Central bankers might not intend to be providing downside insurance to the securities markets, but that is the widely held judgment of market participants. But, “No such protection is offered for real assets, never mind the real economy.” Thus, the central bank operations boost financial asset returns relative to real asset returns and induce the shift away from real investment.
Additional empirical evidence, cited by Spence and Warsh, supports these fundamental arguments. From 2007 to 2014 gross private investment registered extremely substandard growth. Growth in nonresidential fixed investment fell substantially below the last six post-recession expansions. Spence and Warsh calculate that S&P 500 companies spent considerably more of their operating cash flow on financially engineered buybacks than on real capital expenditures in 2014; this has not happened since 2007. According to them, during the past five years, earnings of the S&P 500 have grown about 6.9% annually, versus 12.9% and 11.0%, respectively, from 2003-2007 and 1995-1999. Inadequate real investment means demand for labor is weak. Productivity is poor, which in turn, diminishes returns to labor. According to a Spence and Warsh op-ed article in the Wall Street Journal (Oct. 26, 2015), “... only about half of the profit improvement in the current period is from bu siness operation; the balance of earnings-per-share gains arose from record levels of share buybacks. So the quality of earnings is as deficient as its quantity.”