


There is nothing like an eight-day winning streak to change the market narrative. Stocks have quickly gone from a correction to a comeback this month, and the S&P 500 is now challenging key resistance at 4,400. While a confirmed breakout above this level raises the odds of the correction being over, there are still a few boxes left to check on our technical list before making that call. One of the unchecked items is market breadth. Despite the recent rally, participation in the latest rebound has been underwhelming, raising questions over the sustainability of the advance. Second, 10-year Treasury yields remain in an uptrend, and until more technical evidence confirms the highs have been set, it may be challenging for stocks to maintain their upside momentum.
From A Correction To A Comeback
The S&P 500 officially entered correction territory in late October after falling over 10% from its summer high. Rising interest rates and a steady drumbeat of higher-for-longer monetary policy messaging from the Federal Reserve (Fed) captured most of the blame for the selling pressure. The unexpected Israel-Hamas war, weak seasonal trends, and sputtering economic activity in China also weighed on risk appetite.
As shown in Figure 1, the pullback created a wave of technical damage across the broader market. The S&P 500 violated several key support levels, including the closely watched 200-day moving average (dma). A downtrend subsequently developed via a series of lower highs and lower lows, implying sellers became more enthusiastic than buyers over the last few months. Underneath the surface of the S&P 500, breadth—used to assess the overall participation and strength of a move in the market—has been damaged. As of last week, less than half of the S&P 500 constituents closed above their 200-dma, underwhelming within the context of a bull market and for an index that just rallied over 6% in eight trading days. For additional context, the 200-dma is often used as a simple way to define a trend. If price is above the 200-dma, a security is considered in an uptrend, and vice versa if price is below the 200-dma.
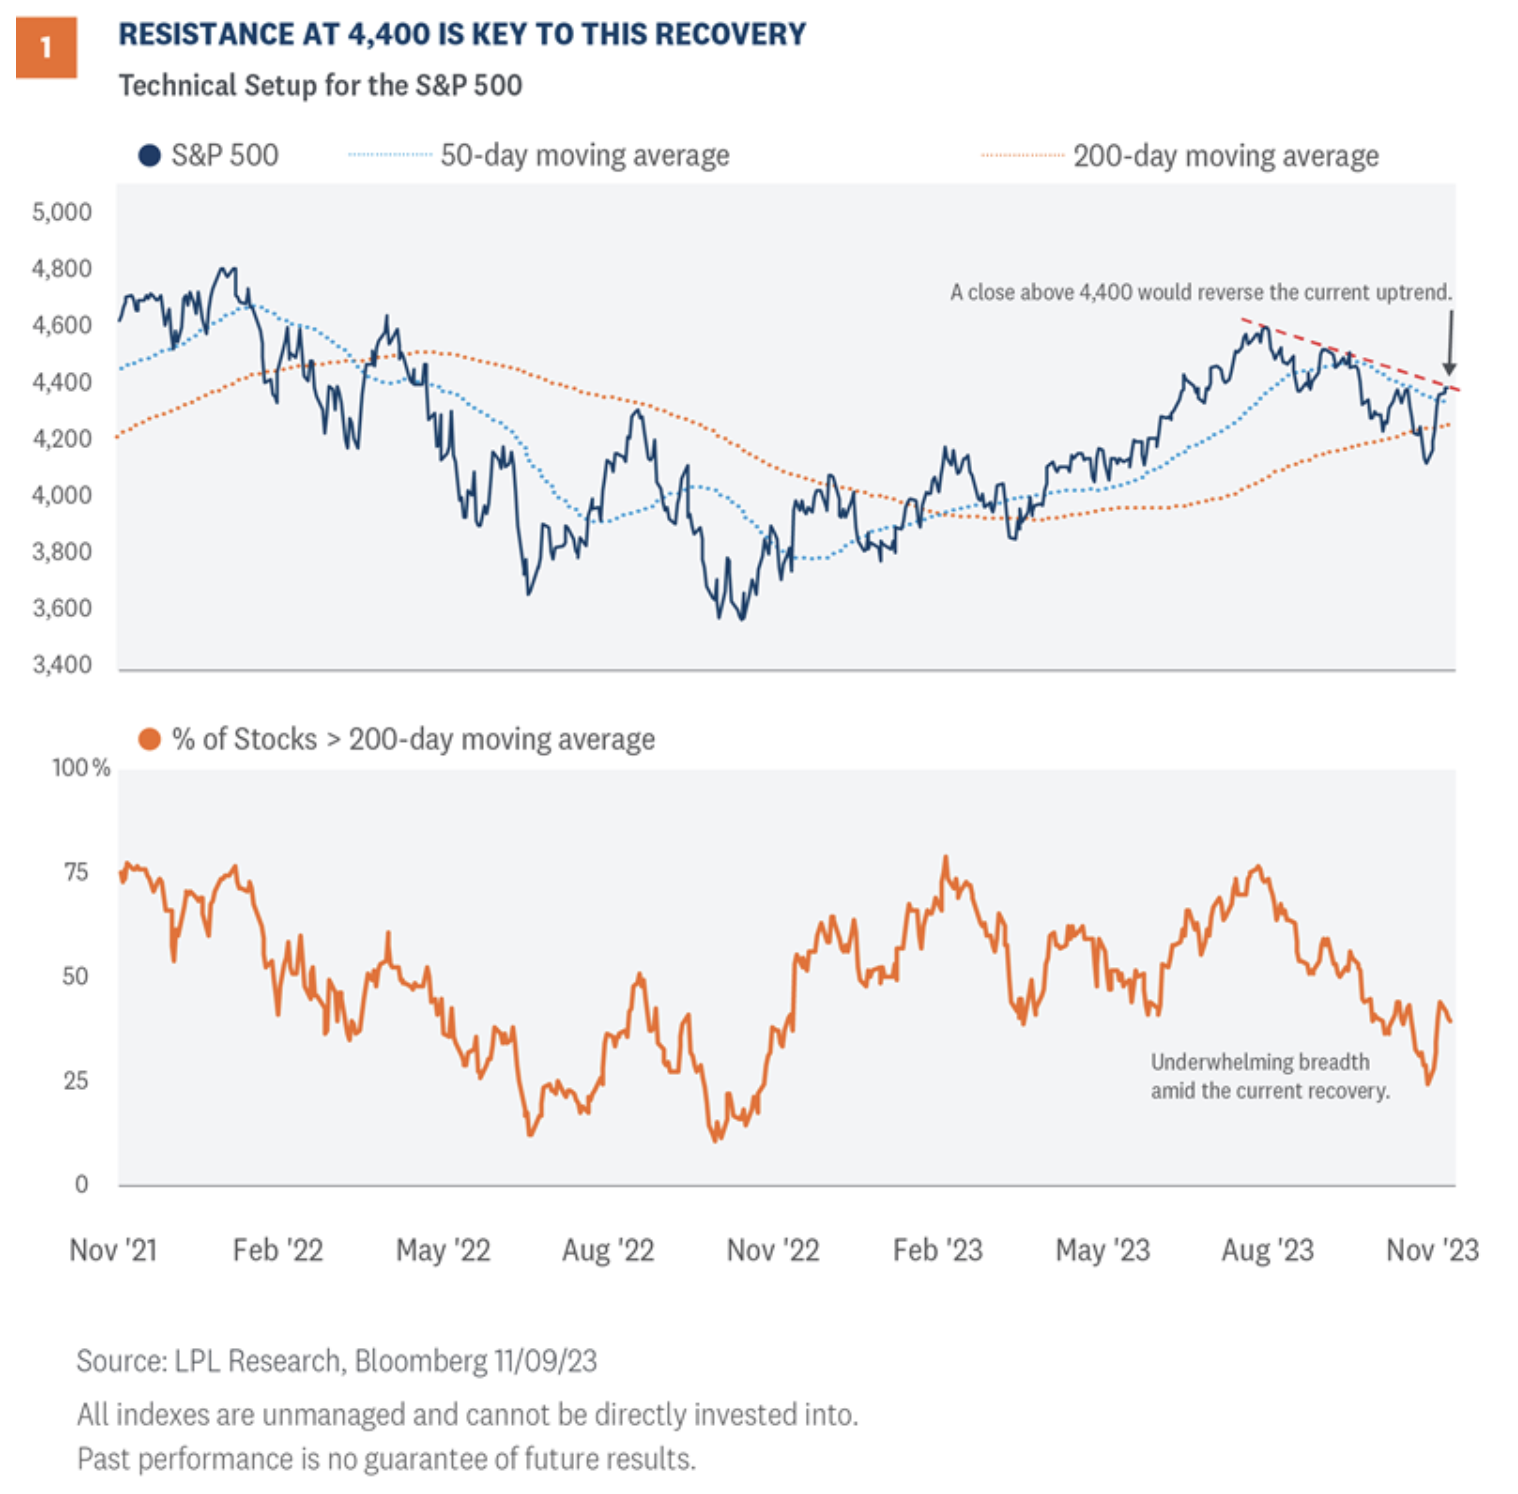
While the technical backdrop for stocks has deteriorated amid the correction, it does not imply the bull market is over. First, corrections are completely normal during a bull market. In fact, the S&P 500’s 10.3% drawdown this year comes ahead of the average 13.2% maximum drawdown for all bull markets since 1950. Second, the recent comeback on the S&P 500 has left the index near key resistance at 4,400. This level is critical for the recovery, as a confirmed move above 4,400 would reverse the S&P 500’s developing downtrend and raise the probability of the correction lows being set last month, especially if the breakout is accompanied by expanding market breadth.
Importance Of Market Breadth
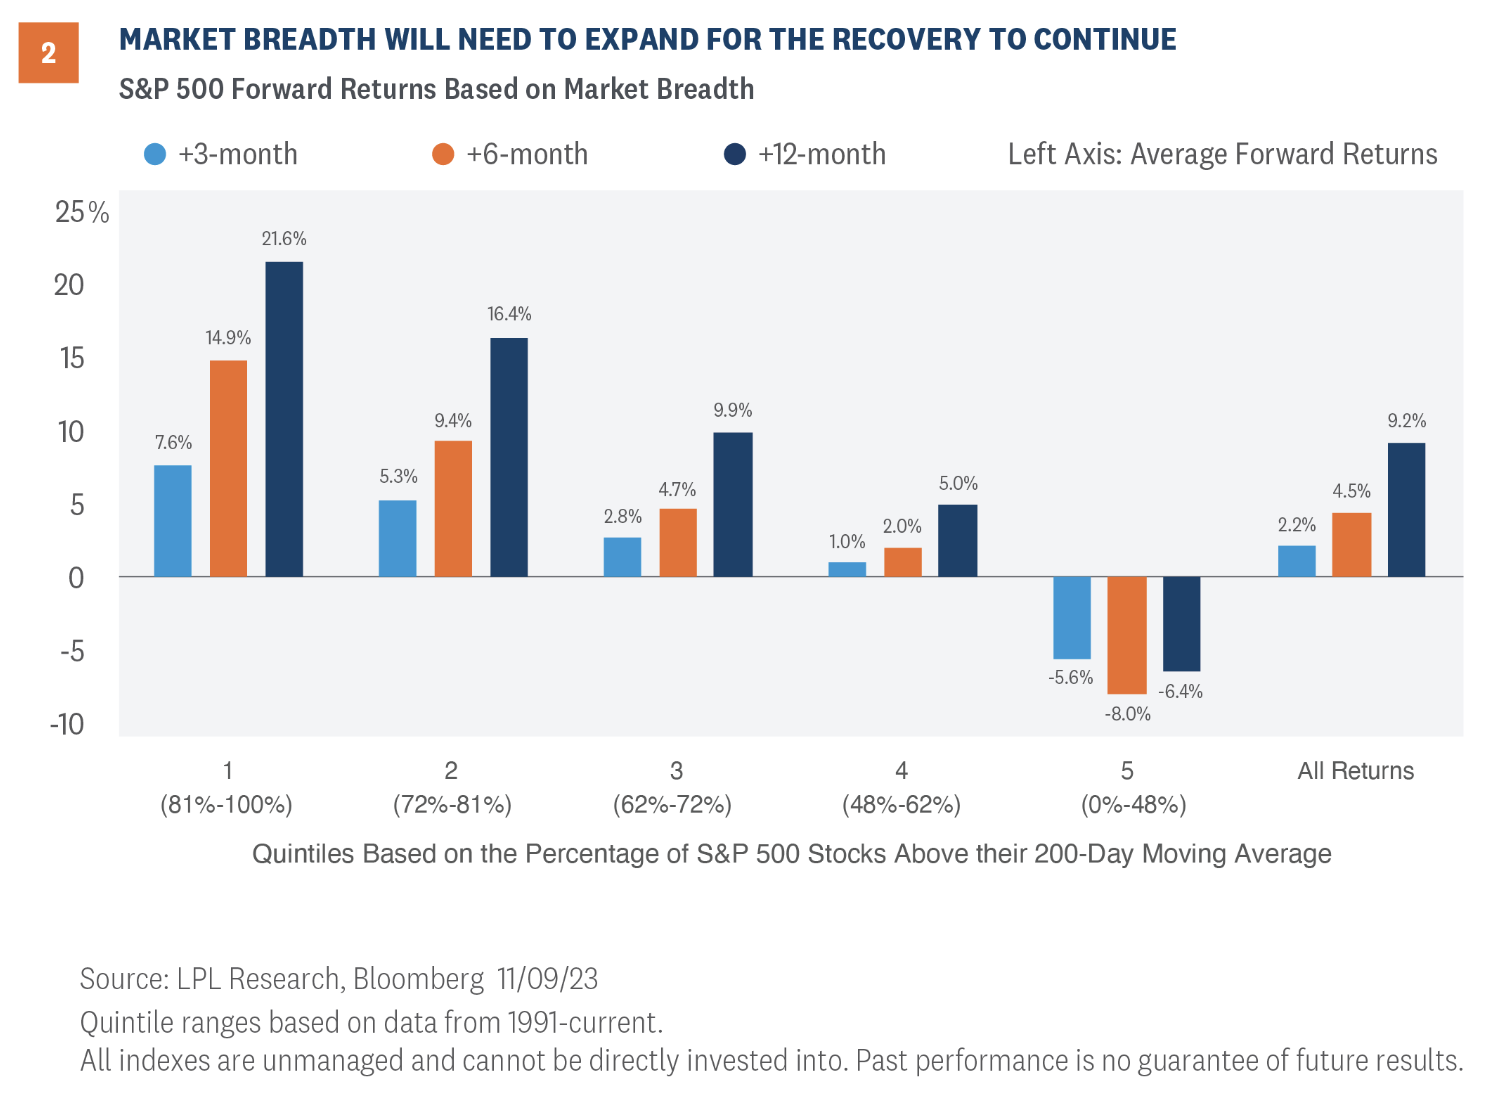
To quantify the importance of market breadth, we broke down the historical percentage of S&P 500 stocks trading above their 200-dma into quintiles. The quintiles split the percentages into five equal portions across the dataset. For example, the top, or first, quintile represents the highest 20% of breadth readings during this timeframe, while the fifth quintile represents the lowest 20%. After filtering the breadth percentages into quintiles, we calculated forward returns across the quintile groups for each period.
As Figure 2 shows, market breadth has been a statistically strong indicator of future S&P 500 performance. The top quintile group, classified as periods when 81% or more of S&P 500 stocks were trading above their 200-dma, has notably outperformed the lower quintile groups along with the average S&P 500 returns across all periods during this period. Unfortunately, the S&P 500 currently falls into the fifth quintile group as only around 40% of constituents closed above their 200-dma last week. Returns in this group have historically been negative over the following 12 months. This data further supports our thesis that broader participation will be required for the S&P 500 to have a sustainable breakout above resistance at 4,400.
A Closer Look At Winning Streaks
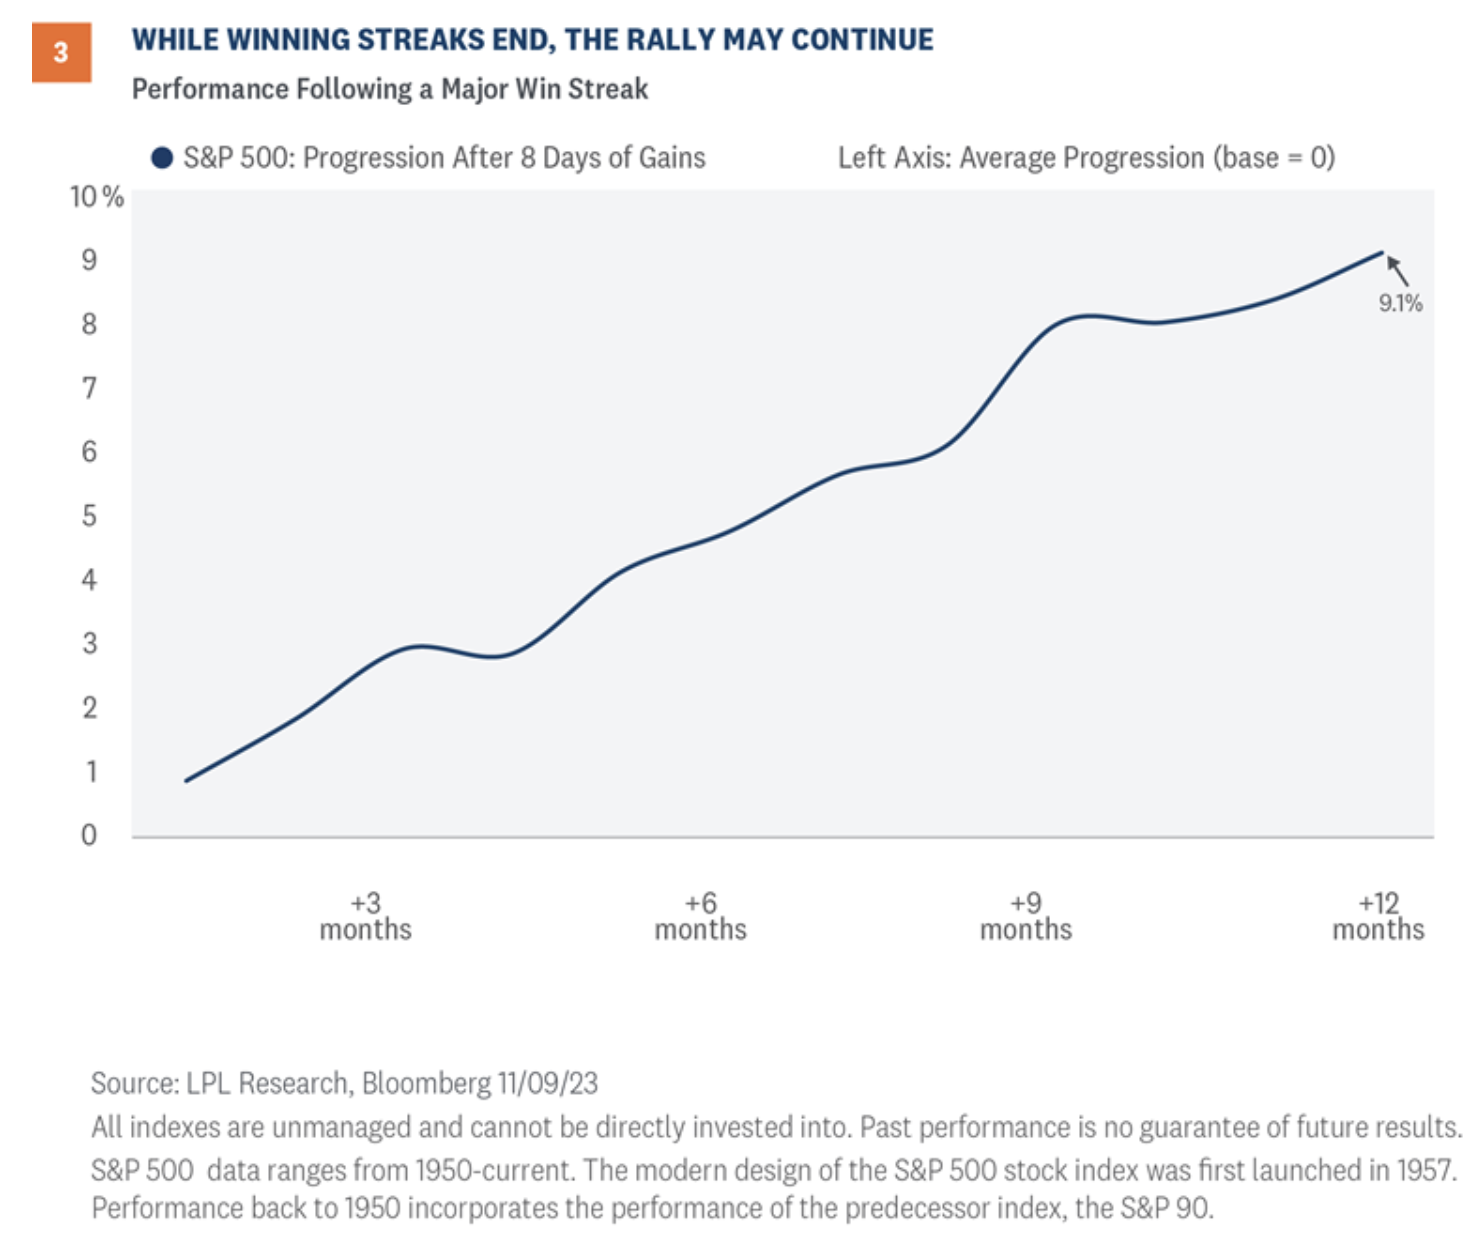
As noted earlier, the S&P 500 wrapped up an eight-day winning streak last week, marking its longest stretch of consecutive gains in two years. Consistent buying pressure of this magnitude is not only rare—eight up days in a row have only occurred in 2.3% of all eight-day periods for the S&P 500 since 1950—but also a bullish sign for improving investor sentiment and market momentum. And while all winning streaks eventually end, history suggests the rally may not. Figure 3 highlights the average progression of the S&P 500 after generating eight days of consecutive gains. On a 12-month basis, the S&P 500 has climbed higher by an average of 9.1%, with 72% of occurrences posting positive results.
Don’t Forget About Rates
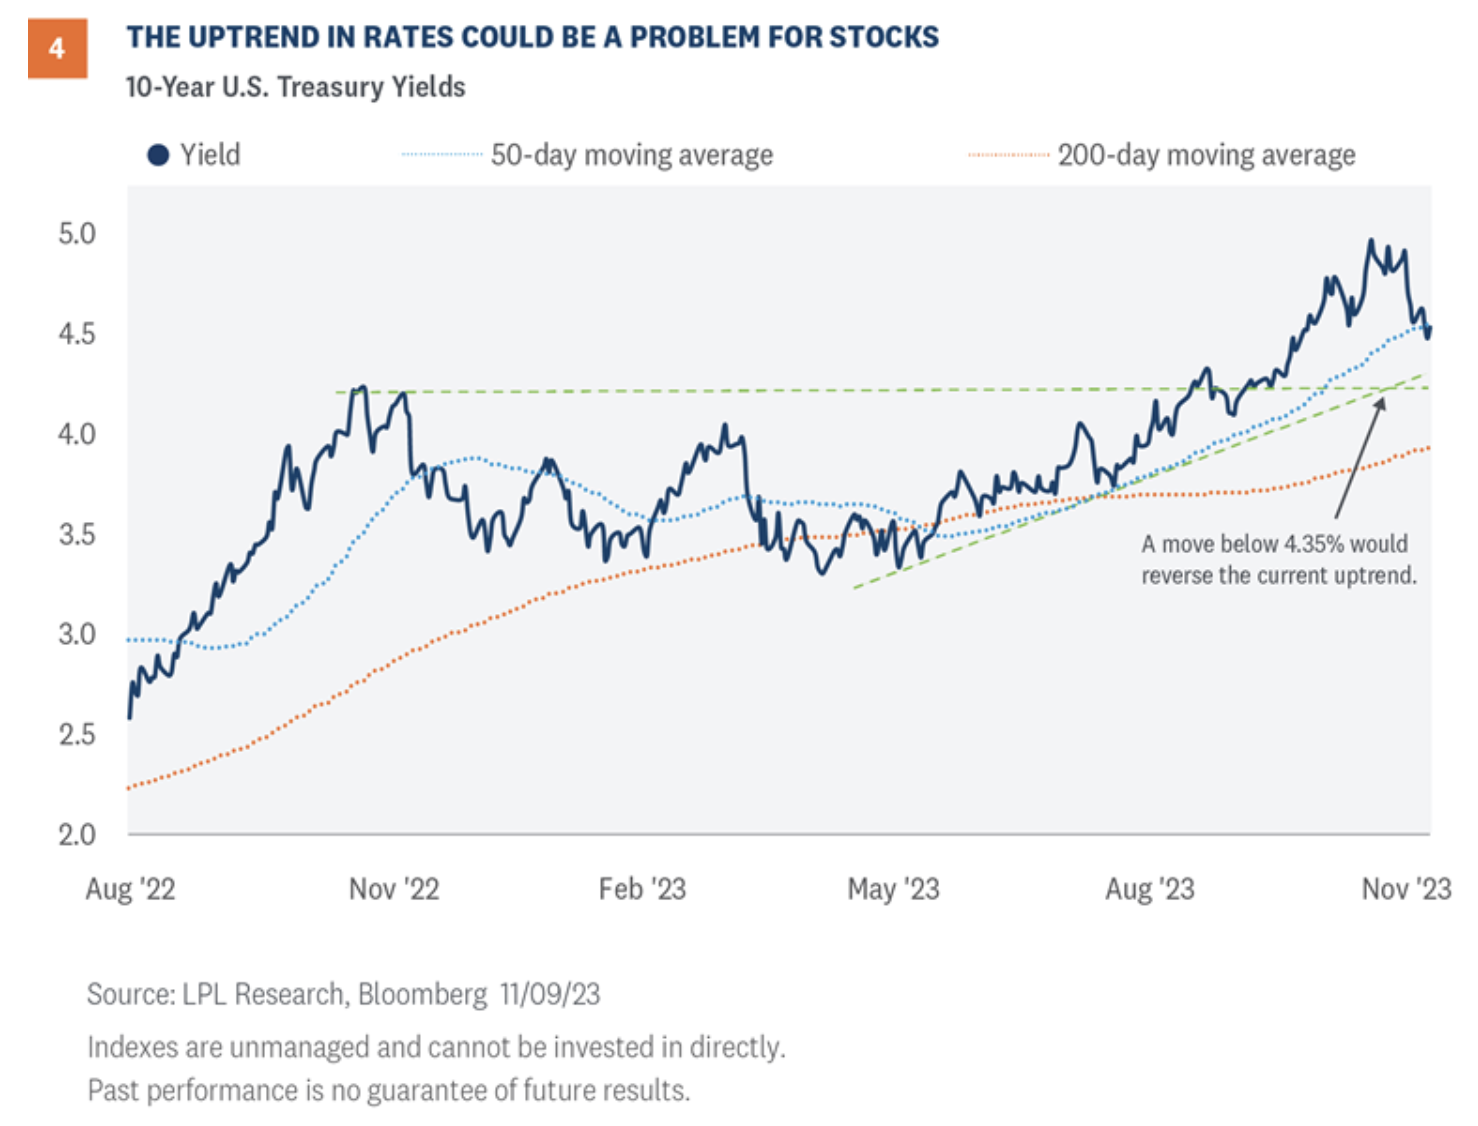
The fixed income market is another key to ending the correction. It is no coincidence that the S&P 500’s July high overlapped with the 10-year Treasury yield breaking out above 4.00%. As shown in Figure 4, upside momentum in yields accelerated from there, proving to be too much too soon for equity markets to absorb.
Surprising to most, the breakout in yields was more predicated on better-than-expected economic data than rising inflation. However, this does not mean the Fed is done with restrictive monetary policy. As Fed Chair Jerome Powell noted during his IMF speech last week, “We know that ongoing progress toward our 2 percent goal is not assured: Inflation has given us a few head fakes. If it becomes appropriate to tighten policy further, we will not hesitate to do so.” This week's consumer and producer inflation reports will provide updated insight into the Fed’s progress in taming inflation.
While the uptrend in Treasury yields provides a solution to the Fed’s fight against inflation, it creates a problem for U.S. equities. Stocks and bonds have become increasingly negatively correlated after 10-year yields surpassed 4.00%. Higher rates obviously weigh on the consumer but also impact equity market valuations, the cost of capital, and hinder overall economic growth—not to mention they make bonds relatively more attractive than stocks. From a technical perspective, a move below 4.35% would be required to break the 10-year’s current uptrend, placing yields back into their previous consolidation range.
Investment Implications
LPL’s Strategic and Tactical Asset Allocation Committee (STAAC) recommends a neutral tactical allocation to equities, with a modest overweight to fixed income funded from cash. The risk-reward trade-off between stocks and bonds looks relatively balanced to us, with core bonds providing a yield advantage over cash.
The STAAC recommends being largely neutral on style, with a slight bias toward growth over value, favors large caps over small, and maintains energy and industrials as top sector picks.
The STAAC downgraded developed international equities last month to neutral based on deteriorating economic conditions in Europe, though the Committee still finds Japanese equities attractive. U.S. equities were subsequently upgraded, buoyed by a relatively stronger economic and corporate profit outlook.
Within fixed income, the STAAC recommends an up-in-quality approach with near benchmark-level interest rate sensitivity. We think munis are an attractive asset class. Investors still concerned about rising Treasury yields and the subsequent spillover into the muni market may be better served by owning individual bonds and/or laddered muni portfolios.
Adam Turnquist is chief technical strategist for LPL Financial.