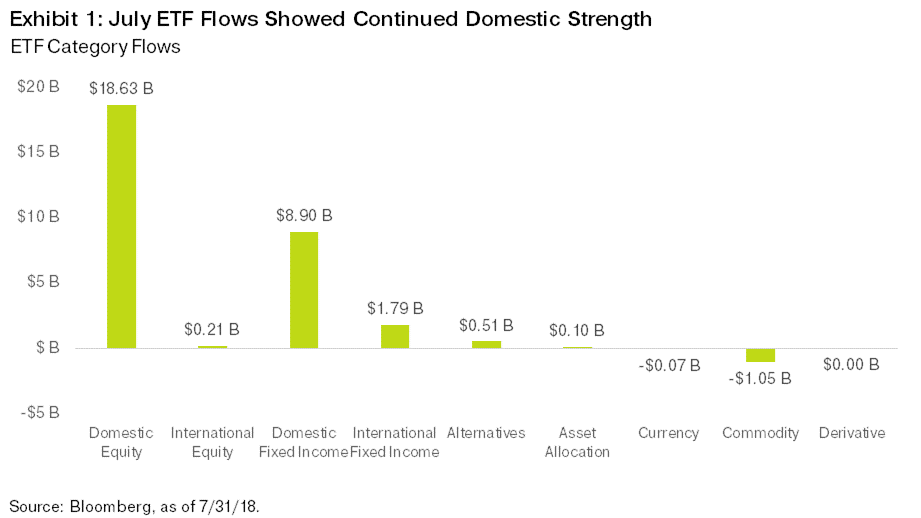
After shedding nearly $2 billion in ETF assets under management (AUM) during choppy June trading, July flows staged a strong comeback, with nearly $30 billion net coming in the door. The month of solid inflows has brought the year-to-date total to $153 billion, but it’s nearly 45 percent below last year’s pace. At this point in 2017, we had $272 billion in net new flows.
Looking back to 2016 provides some context. By this point in 2016, ETFs took in $111 billion in net new assets. While we trail 2017’s total, we are well ahead of 2016’s pace, making it a solid-but-unspectacular year so far.
High-Level View Stays Thematically Consistent
July’s markets and ETF flows generally followed the trends set to date in 2018. Healthy corporate earnings provided a steady backdrop for U.S. equities to continue functioning as the best game in town. As of July 27, 83 percent of S&P 500 companies that had reported earnings beat their estimates. If that number holds for the entire index, it will be the highest percentage of earnings beats since FactSet began aggregating the figure in 2008. Simultaneously, U.S. annualized GDP growth came in at a strong 4.1 percent for the second quarter, much stronger than the Eurozone economy, which reported an annualized 1.4 percent growth rate. In fact, this divergence in GDP growth rates between the two regions created the widest differential since 2014.

Small-Cap Trade Losing Steam
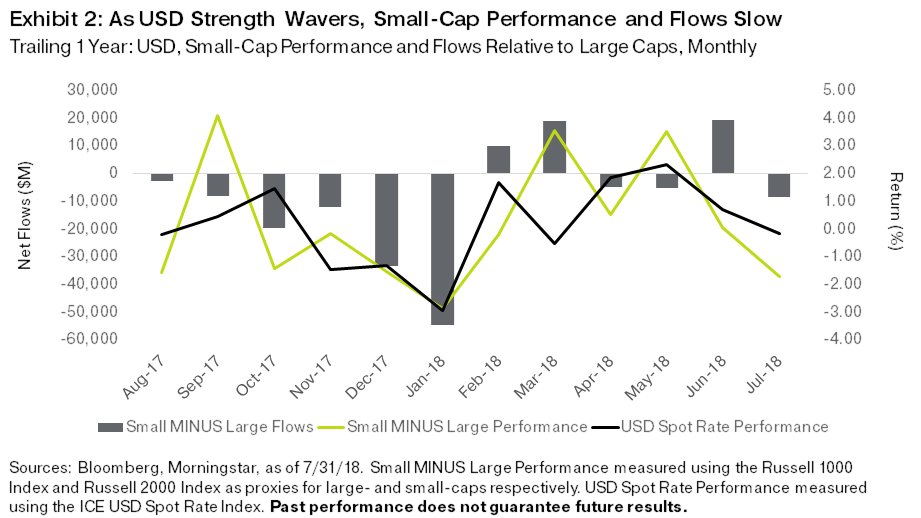
Given the combination of steadily rising rates and fiscal stimulus reverberating into an already strong U.S. economy, the U.S. dollar has had a fantastic run this year relative to both developed and emerging currencies. Yet the strong dollar eased and marginally changed course in July, as the White House vocalized concerns about this stronger dollar acting counter to their stringent global trade efforts. Small caps have largely followed the dollar this year, and after four straight months of outperforming their large-cap peers, they were shoved to the sidelines, underperforming large caps by nearly 2 percent in the month of July alone. With just a hint of weakness, we saw money pour out of small-cap ETFs—the category lost $8.5 billion relative to large caps, the most since January of this year.

Investors Return to the Value Well as Growth Stocks Take a Dive
The market has been all about growth stocks since the start of 2017. From January 2017 through July 2018, growth has outperformed value by a whopping 27.6 percent. This performance differential has brought with it some lofty expectations for growth companies, and certain growth investors lost big in July as Facebook tumbled significantly on slowing user growth and a disappointing outlook. This fueled a rotation of sorts at the end of the month to value stocks—the last full week of July was the best week of 2018 for value stocks relative to growth stocks. In fact, the greater-than 4% outperformance of value over growth during the three-day period from July 26 through July 30 was the best we’ve seen in 10 years. ETF investors certainly took notice: Exhibit 3 highlights weekly flows and performance of value relative to growth, and the rush of money that traded from growth to value during the last week of July.


