


The seeding process of teams began in 1979 as a way for the NCAA to make sure that the strongest teams didn’t end up meeting each other too early in the tournament. The seeding also provides the uninitiated in basketball a basis for which to make decisions in recreational office pools. We know that picking a number 16 seed to beat a number 1 seed is not statistically a good bet in most pools. In fact, never in history has a 16 seed beaten a 1 seed.
While past performance certainly does not guarantee future success, the data show that seeding is a helpful predictor of success. Top-seeded teams don't always survive the test to the Final Four, but historically these teams win about 80 percent of the games they play. A #16 seed has never won a game and the #13-#16 seeds combine to win just slightly more than 10 percent of the games they play.
Of course, a key difference here is that stock prices take into account future potential, so it should be harder for “top seeds” to continue to have success. But is it?
There have been many academic publications that show the beneficial effects of relative strength, or momentum, for long term outperformance. However, they often are criticized for not effectively mimicking real-world conditions. To measure the effect of relative strength in a “real world” way, Dorsey Wright developed a Monte Carlo simulation process that assumes continuous portfolio management, selecting small portfolios (50 holdings) of top-decile stocks as determined by relative strength, which are held in the portfolio until they show weakness (by falling top the bottom half of rankings). A key goal of the study was to determine the best length of time to look back to determine relative strength.
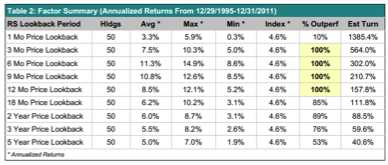
Our Relative Strength and Portfolio Management study showed that relative strength is most effective as an intermediate term factor. Over the study period (Dec 29, 1995 to Dec 31, 2011), the very best performance was achieved by looking back 6 months to determine relative strength. Looking back just 1 month delivered worse than market performance, while long lookback periods (over 1 year) were moderately successful, but less effective. Nothing works every year and in every market – but when applied over the 16 year period of our study, intermediate relative strength portfolios strongly outperformed.
In other words, by looking back over 6 months and selecting top-decile relative strength stocks, we have found our #1 seeds.
Below is a table showing the portfolio results for portfolios based on different lookback periods.
 For the sports fan, this time of year will always be associated with college basketball. “March Madness” is in full swing, and casual fans are following their brackets with interest. Bracket pools give fans the chance to play expert and measure their performance against peers and friends. There is no reward for favorite teams "hanging in there" against a major conference powerhouse, and style points are not included in the ultimate accounting process. Though the action on the court is exciting, tournament “seeding” was key to making the tournament a mainstream cultural event.
Winning Pecentage, by Seed, for NCAA Men's College Basketball Tournament: 1985 – 2012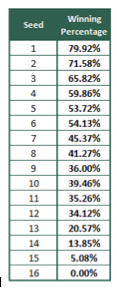
The process of "seeding" teams in the NCAA Basketball Tournament can be applied to the stock market, as well. The way that we "seed" stocks is through the use of relative strength - also known as "momentum". Relative Strength measures the price performance of a stock over a certain period versus a market average or universe of stocks. By measuring the relative strength of a universe of stocks, we can establish a rank-order and assign scores, "seeding" the market in the same way that the NCAA Selection Committee evaluates the performance of teams over the course of the season in order to help determine their seed in the tournament.
Just like the NCAA Selection Committee is not going to make "seeding" decisions based on a team winning one or two games, it is not reasonable to expect you to make portfolio management decisions based on very short term performance; however, by using the relative strength ranking system you can identify when outperformance has, in fact become a trend of outperformance.
Tom Dorsey is President and co-founder of Dorsey, Wright & Associates. For over 25 years, Dorsey, Wright & Associates has provided technical analysis research to financial professionals worldwide. Tom has authored numerous books on investment strategy, and is widely known for his expertise in Point & Figure charting and Relative Strength analysis.
March Madness Market Parallel
April 5, 2013
« Previous Article
| Next Article »
Login in order to post a comment