


The Bureau of Labor Statistics reported a decline in nonfarm business productivity in the preliminary estimate for 2Q16, with a further increase in unit labor costs. Quarterly figures can be erratic, but the trend in output per worker remains weak – a 0.5% annual rate over the last five years.
Note that productivity growth figures have slowed less for the nonfinancial corporate sector (averaging about 1.0% per year over the last five years), but they’ve still slowed.

Faster productivity growth means that you get more output per worker. Additionally, for any given wage, it means you get more output per dollar spent on labor. A rise in unit labor costs will result in higher consumer price inflation (if firms can pass the increase along) or eat into corporate profit margins (if they don’t have pricing power). Over time, this can have a major impact on some firms and some industries.
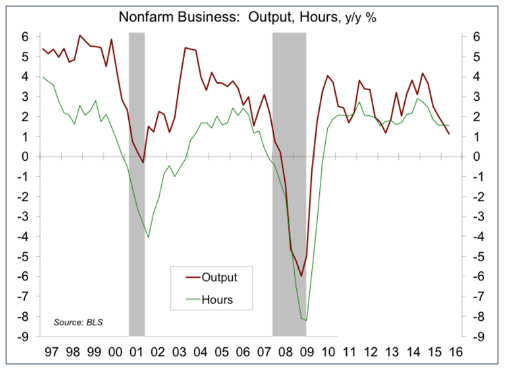
It’s unclear why productivity growth has slowed. It could be a measurement issue, but that’s not likely. Low capital spending seems a likely culprit. Some cite federal regulations, but most business regulations are state and local. A slower turnover rate in the economy seems to be factor (as high-productivity jobs are replacing low-productivity jobs at a slower pace). Regardless of the cause, a slower trend in productivity growth would have a significant impact on how we live. Lower spending on research and development (public and private) isn’t going to help.
The signal and the noise
August 8 – August 12, 2016
It’s usually simple when the economy is booming or falling apart. The bulk of the economic data line up accordingly. However, when growth is moderate and not necessarily firing on all cylinders, the data can be all over the place. The financial markets may be susceptible to the noise in the data, but Fed policymakers will look at the bigger picture.

Real GDP growth was mixed in the first half of this year. Consumer spending growth (about 70% of GDP) was strong, even as some activity appeared to have been shifted from the first quarter to the second (likely reflecting weather and the early Easter). Other components of GDP were soft or a bit negative. Inventories, adjusted for inflation, fell in 2Q16. That could reflect business pessimism or demand may have been stronger than anticipated, but the data also show that inventories had grown less lean relative to sales over the last year. Some of the inventory adjustment may have been natural, bringing them more in line with the pace of sales. It’s hard to say for sure. Anecdotal information is mixed.

The July data on personal income and spending, along with annual benchmark revisions, show a surprising slowdown in the growth of real disposable income per capita (a 1.1% annual rate over the last six months, vs. +3.2% for the second half of 2015). To be clear, wage and income data are often revised. So this slowdown may not be genuine. Moreover, the July employment data (growth in jobs, hours, and hourly earnings) points to a pickup in personal income into 3Q16. Unit motor vehicle sales rose sharply in July, also suggesting that consumer spending growth is on track for another strong quarter (the July retail sales figures, due Friday) will help to clarify.
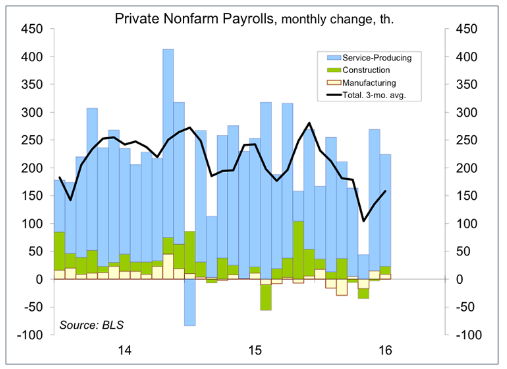
The May and June payroll figures should have taught the markets that the data are noisy. Figures for any particular month should be taken with a grain of salt. Judging by the market reaction to the July payroll figure (+255,000), nobody learned a thing. The July payrolls appear to have been inflated a bit by the seasonal adjustment (state and local government jobs up 35,000). Private-sector payrolls averaged a 158,000 monthly pace over the last three months and +167,000 over the first seven months of this year – not bad, but slower than in the last couple of years (+221,000 in 2015 and +240,000 in 2014). It’s unclear how much of that slowing is due to increased business caution and how much is due to a tighter job market.
While the financial markets don’t do nuance, most Fed officials are well aware of the various quirks and oddities in the economic data reports. What figures does the Fed look at? Pretty much everything, including anecdotal information. However, in deciding when to hike, the Fed has indicated that it will be emphasizing the job market and the inflation outlook. There will be another employment report before the September 20-21 policy meeting. The August payroll figures (along with possible revisions to July) should help to clarify the underlying trends in the job market. In the meantime, choppy and uneven economic data may whip the markets around.