


The S&P 500 Index is vacillating between gains and losses Thursday. If it closes in the green, the benchmark will have risen for nine straight days, its longest streak since 2004. That’s a fun fact to throw in the faces of the avowed super bears predicting a 1929-style market crash, and it’s bound to generate countless news articles. But it’s also a meaningless superlative about an otherwise anemic stock market fueled by trends in bonds, not expectations of future profitability.
Let’s get the superlatives out of the way. According to numbers run by Deutsche Bank AG analysts, there have been only 31 nine-day runs in the last 95 years. There hasn’t been a 10-day streak since 1995, but the bank calculates they happen every 6.3 years on average. According to the Deutsche note:
... for every day this run continues the rarity values roughly doubles until we get beyond day 12, a point where there’s only been one longer run, a 14-day winning streak in 1971... If it continues going up though, then next week could see an event rarer than Halley’s Comet.
(Halley’s Comet is seen roughly every 76 years.)
Okay, so what?
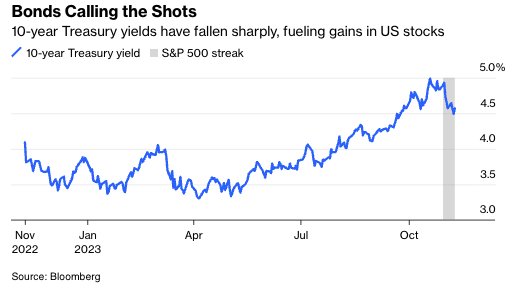
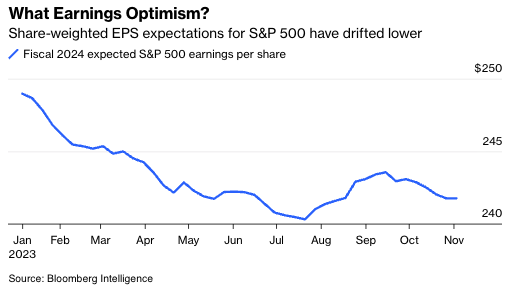
First, consider the drivers behind the streak. Suffice it to say that of the eight up days so far, four or five have been primarily driven by the sharp gains in Treasury securities. Wall Street’s outlook for index-wide 2024 earnings has drifted slightly lower in recent weeks and has more or less been flat since April, with fixed-income markets overwhelmingly holding sway. When yields fall, the discount rates we use to value stocks decline as well, pushing stock prices reflexively higher.
For their part, bonds are essentially in a mini-snapback rally after investors got carried away predicting fiscal doom, enduring inflation and perhaps permanently higher neutral rates. I’ve been modestly optimistic about bonds recently, but there hasn’t been a whole lot of fundamental news behind the rally. At the margin, I might cite hints about a slightly less-bad-than-expected bond supply glut and a Fed that’s sounded ever-so-mildly more dovish. But mostly it’s just been a shift in sentiment, and that’s a temperamental factor that could easily turn again.
Breadth has also been less than stellar. From Monday to Wednesday this week, more S&P 500 stocks declined than advanced and overall returns were essentially carried by Microsoft Corp., which benefitted from a reported rebound in cloud growth, and Apple Inc., whose stock has defied weak revenue from China to go on a bit of a tear.
In many disciplines, streaks are thought to be self-sustaining phenomena. Listen to press conferences with professional basketball, soccer or football players, and they’ll repeatedly allude to their efforts to get the ball to the player with the “hot hand.”
But even in sports, the significance of streaks is up for debate. In a now-famous 1985 paper “The hot hand in basketball: On the misperception of random sequences,” researchers Thomas Gilovich, Robert Vallone and Amos Tversky found that the widespread belief among players and fans in the hot-hand phenomenon was ultimately misplaced; it was a fallacy.
Since 2015, a string of interesting research—including Joshua Miller and Adam Sanjurjo’s work on coin flips and, more accessibly, sports journalist Ben Cohen’s book The Hot Hand: The Mystery and Science of Streaks—has reopened the debate and suggested that, yes, there may well be something behind streaks in sports. Further complicating matters was Robert M. Lantis and Erik T. Nesson’s analysis of the hot hand in the NBA 3-point contest from 1986-2019, where they found the following:
Even making three shots in a row has no effect on making the next shot if a player moves locations. Our results suggest that any hot hand in basketball is only present in extremely similar shooting situations and likely not in the run-of-play.
In other words, there’s some evidence for the hot hand, but it’s more nuanced than we usually think. If it’s that hazy in basketball, imagine how unhelpful it must be to focus on streaks in the stock market. Ball players would seem to benefit from the adrenaline kick that comes from sinking a few shots and hearing crowds cheer them on; the S&P 500 is just an inanimate collection of stocks traded, often by cold, heartless computers. (If I’ve piqued your interest, my Bloomberg colleague Barry Ritholtz has spoken with protagonists in the debate including Gilovich, Miller and Cohen for his podcast.)
At the time of writing, the U.S. equity benchmark had been vacillating in a range of -0.7% to +0.2% on the day and there was a chance that it may just experience that Halley’s Comet moment. But with bonds driving the moves and extremely meek breadth, it’s proving far less inspiring than the celestial phenomenon—and tells us little about where we go next.
Jonathan Levin is a columnist focused on U.S. markets and economics. Previously, he worked as a Bloomberg journalist in the U.S., Brazil and Mexico. He is a CFA charterholder.