


Phantom Stock Market
Maybe we could just allocate more to equities? That is one possible solution, but the historical record suggests that might make our task even more challenging! When I start thinking about future possible returns, one of the first phone calls I make is to my friend Ed Easterling of Crestmont Research. He and I have collaborated on numerous papers on market cycles and future returns, most recently “It’s Not Over Until the Fat Lady Goes on a P/E/ Diet.” His website is a cornucopia of data and analysis. Let’s look at a few of his charts and conclusions.
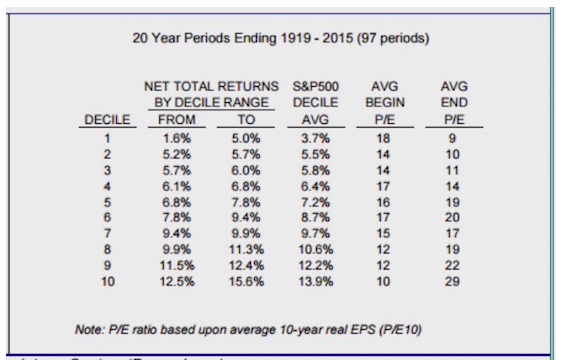
One of the more reliable predictors of future returns is the current price-to-earnings (P/E) level. There are only three sources of stock market growth: EPS growth, dividend yield, and the change in P/E ratios (http://www.crestmontresearch.com/docs/Stock-Waiting-For-Avg.pdf). Where you start from gives you an excellent indication of the range of returns you can expect to get over the following 20 years. For most people, 20 years can be considered the long run.
Today the normalized P/E ratio is 23, which is right up there in the top 10% of historical rankings. Even if you want to quibble and drop the ratio a few notches, it’s still high. And by looking at the chart below, we find that historical returns 20 years on have ranged from 1.6% to 5.0%, with an average of 3.7%.
There is no historical instance of price-to-earnings multiples expanding from where we are today for any sustained length of time. In fact, levels like those we see today have generally indicated a brewing storm – a bear market. That doesn’t mean something new can’t happen this time. There are those who argue that because interest rates are so low, we can expect earnings multiples to continue to rise. Maybe, but for how long and how by how much?
If you take the highest historical return of 5% (from our current P/E) and marry that with the bond returns we discussed earlier, you find your 60/40 portfolio can now be expected to give you 4.2%. And the average historical equities return of 3.7% leaves you with only a 3.5% total return on your investment portfolio!
And the return level makes a huge difference to the eventual success of a pension. As in, a monster difference. Most people don’t realize that most of the money their pension will pay them in 20 or 30 years will come from the growth of the portfolio and not from their actual contributions. As we will see, your contributions might actually amount to as little as 20 or 25% of the total portfolio 20 years from now.
I’m going to start with a modest number, but you can add zeros to your heart’s content. Let’s say you save $1,000 a year for the next 30 years. Your pension consultant tells you that you can make 8%. And if you actually do, you find you have paid in $30,000, but your account has grown to $123,345.87, or over four times your contributions. Not a bad day at the office. You stick that into a 5% CD (bear in mind that we’re talking a fantasy outcome here), and you make $6,000 a year, or about $500 a month. Add a zero and save $10,000 a year for 30 years, and now you’re earning $5,000 a month, which, with a paid-for home and Social Security, provides you a comfortable, if somewhat frugal, lifestyle.
But what if you get only a 6% total return? Well, now you only have $84,801.68 after 30 years. Your 5% CD gets you only $4,000 a year. If you were able to save $10,000 a year, your monthly income would be roughly $3,500. Not bad, but much tighter. But that outcome depends on your being able to get 5% on your bonds or CDs. Do you want to bet your future that interest rates are going to be that much higher in 20 years? Maybe you need to save more.
Let’s turn to a little graph that my associate Patrick Watson whipped up for me in Excel. The top, gray line represents the 8% scenario; the middle, orange line is the 6% scenario; and the lower, blue line is the more pessimistic (but maybe realistic) 4% return.
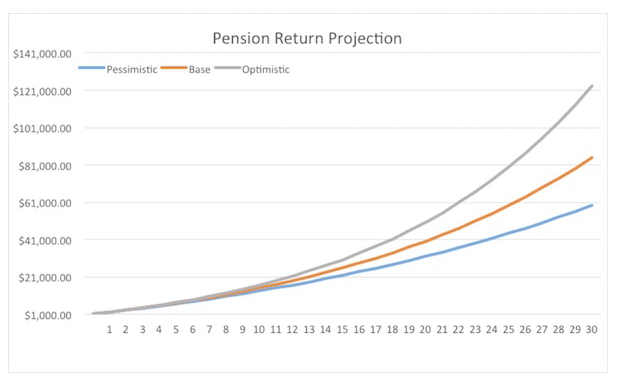
What does that 4% return look like 30 years down the road? Your $30,000 in contributions have not even doubled, leaving you with just $59,328.34. That’s right, you don’t even get a double. And in our far distant future, that 5% CD is only going to give you $250 a month. Or if you save $10,000 a year for 30 years, you’ll be living on $2,500 a month.
But these numbers assume you don’t have to deal with that pesky inflation thing. A mere 2% inflation will guarantee that your money will be cut by about half after 30 years. (So even that $5,000 a month if you really make 8% won’t turn out to be that much of a lifestyle. And God forbid you make only 4%.)