


Election years have historically been good for stocks, and this year has been no different, although with less volatility than we would expect during the summer of an election year. That relative calm may partly reflect that the market is increasingly pricing in greater certainty that would come with a Hillary Clinton victory, as her support has climbed in the polls. This week we look at what the stock market and some politically sensitive industry groups may be telling us about the potential outcome of the presidential election in November.
WHERE’S THE ELECTION YEAR VOLATILITY?
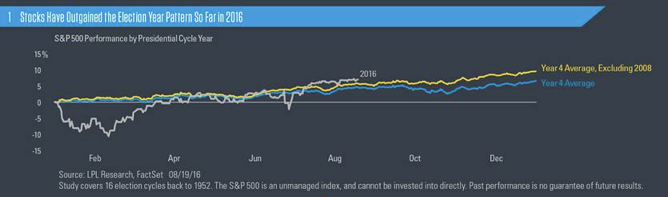
Election years have historically been good for stocks, though with some volatility, as we wrote in our election themed Weekly Market Commentary back in May (“What Might Trump the Election Year Pattern?”). That volatility during election years has historically come during the middle and late summer months—in other words, about now. Although each cycle is different (especially 2008), in recent decades we have observed that the volatility tends to subside, and a late-year rally ensues, when markets have more clarity on the candidates’ platforms and start to price in a winner.
So where has the volatility been this summer? As shown in Figure 1, the S&P 500 has gone up in nearly a straight line since mid-February, with a very short-lived interruption for Brexit before continuing its advance. This year’s gains have exceeded the average election year’s gain going back to 1952 (6.6%) and are on track to outgain the average election year, even if 2008 is excluded (9.6%).
Certainly improving economic conditions have played a key role in the stock market’s steady gains over the past six months. But we believe the market has begun to price in strong odds of a Clinton victory as her lead in the polls has increased, which brings more predictability than a Donald Trump administration. There is still uncertainty to clear up in terms of both candidates’ agendas, as well as what they could actually get through Congress, which could lead to more volatility. The Senate could go either way at this point, while some nonpartisan, and even right leaning political pundits acknowledge that the Republican’s House majority may even be at risk in the event of a Clinton landslide victory.
THE STOCK MARKET’S VOTE
We can speculate that recent stock market gains partly reflect greater certainty under a Clinton administration. But polls can be wrong (case in point: Brexit). It’s possible that the market’s strength has little to do with the election. So perhaps a better question to ask is: Do strong stock markets predict elections?
It appears at this point that the stock market’s vote is aligned with the polls. Since 1928, a stock market increase over the three months leading up to the November presidential election has an 82% success rate at predicting the winner [Figure 2]. In 18 of the 22 election years going back to 1928, the gain or loss in the stock market over August, September, and October accurately predicted which party won. For years in which the election followed a two-term president (1940, 1944, 1960, 1988, 2000, and 2008), the track record has been perfect, but granted, this covers a limited number of occurrences.
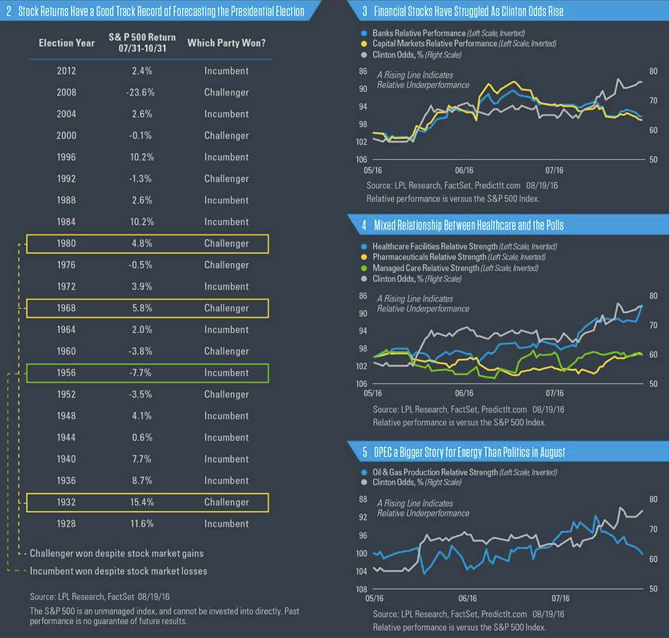
The exceptions to the “vote of the stock market” are 1932, 1956, 1968, and 1980, when the challenger won despite stock gains, or when the incumbent won despite a stock market decline over the period. No market indicator is perfect for every election; however, the stock market’s vote has been fairly predictive over the years and suggests that the stock market and the polls are in agreement, at least for now.
The performance of the U.S. economy, and specifically income growth, is also a good predictor of election outcomes, as we noted in the Midyear Outlook 2016: A Vote of Confidence. This indicator is suggesting a slight edge for the Democrats.