


Here, you can see that when valuations roll over, with the change dropping below zero over a 10-month or 200-day period, the market itself typically drops shortly thereafter. Even with the recent volatility, strong stock market performance has kept the long-term trend in valuations at a healthy positive level, well above the trouble zone. Therefore, this indicator shows low immediate risk.
Signal: Green light
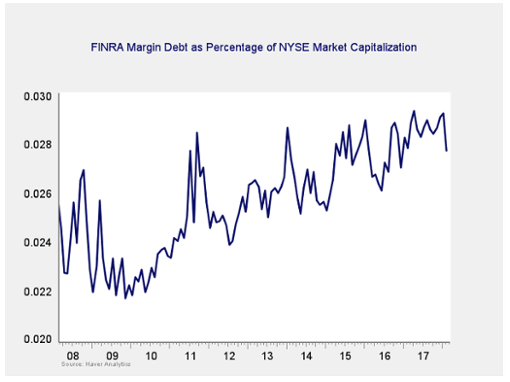
Risk factor #2: Margin debt. Another indicator of potential trouble is margin debt.
Debt levels as a percentage of market capitalization dropped over the past couple of months. While they are still close to all-time highs, clearly borrowers are derisking—which is a positive sign. The overall high levels of debt are concerning; however, as noted above, high risk is not immediate risk.
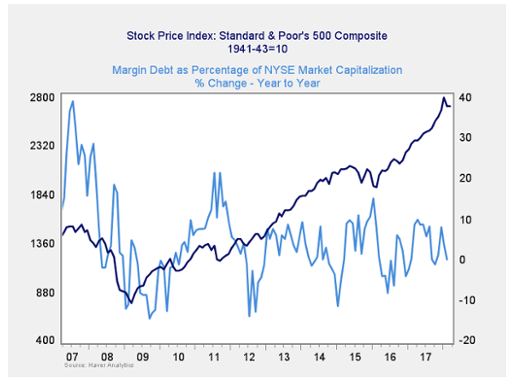
For immediate risk, changes in margin debt over a longer period are a better indicator than the level of that debt. Consistent with this, if we look at the change over time, spikes in debt levels typically precede a drawdown.
As you can see in the chart above, the annual change in debt as a percentage of market capitalization has ticked down in recent months, moving close to zero. So, this indicator is not signaling immediate risk. But the overall debt level remains very high, and we have seen something approaching a spike in recent months. As such, the risk level remains worth watching. We are keeping this at a yellow light.
Signal: Yellow light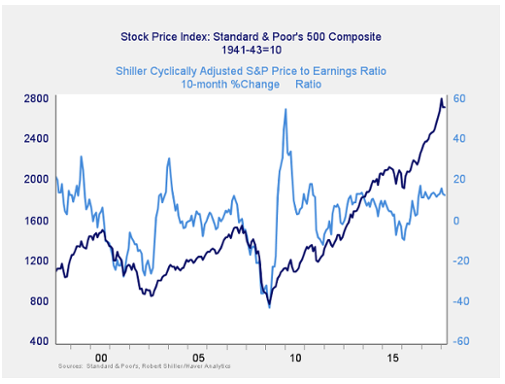
Market Risk Update: April 2018
April 13, 2018
« Previous Article
| Next Article »
Login in order to post a comment