


Signal: Red light
Market Risk
Beyond the economy, we can also learn quite a bit by examining the market itself. For our purposes, two things are important:
- To recognize what factors signal high risk
- To try to determine when those factors signal that risk has become an immediate, rather than theoretical, concern
Risk factor #1: Valuation levels. When it comes to assessing valuations, we find longer-term metrics—particularly the cyclically adjusted Shiller P/E ratio, which looks at average earnings over the past 10 years—to be the most useful in determining overall risk.
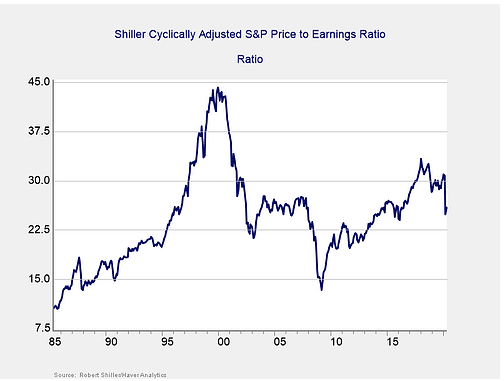
Valuations increased modestly in April, from 24.9 in March up to 25.88 in April. This follows a steep drop from 30.79 in February. Valuations now sit at levels last seen in early 2016, which indicates that risks still remain, despite the volatility in March and subsequent rebound in April. Overall, valuations remain high compared with historical norms.
Even as the Shiller P/E ratio is a good risk indicator, however, it is a terrible timing indicator. To get a better sense of immediate risk, we can turn to the 10-month change in valuations. Looking at changes, rather than absolute levels, gives a sense of the immediate risk level, as turning points often coincide with changes in market trends.
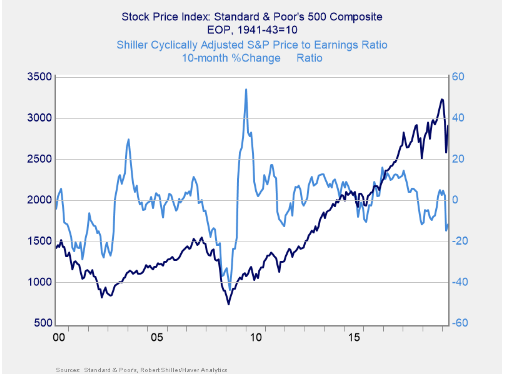
Here, you can see that when valuations roll over, with the change dropping below zero over a 10-month or 200-day period, the market itself typically drops shortly thereafter. This relationship held in March, as valuations and the index both rolled over during the month before partially rebounding in April.
Given the rebound in valuations and markets during the month, we’ve upgraded this signal to a yellow light for now, with a downgrade to red possible if volatility picks up in May.