


Signal: Yellow light
Risk factor #2: Margin debt. Another indicator of potential trouble is margin debt.

Debt levels as a percentage of market capitalization had dropped substantially over the past two years, to close to the lowest levels of the recovery, before spiking dramatically in February to an all-time high on the market decline. The March rebound saw this measure of market debt come back down, but only to levels last seen in 2018. Despite the pullback in March, margin debt remains very high on a historical level.
For immediate risk, changes in margin debt over a longer period are a better indicator than the level of that debt. Consistent with this, if we look at the change over time, spikes in debt levels typically precede a drawdown.
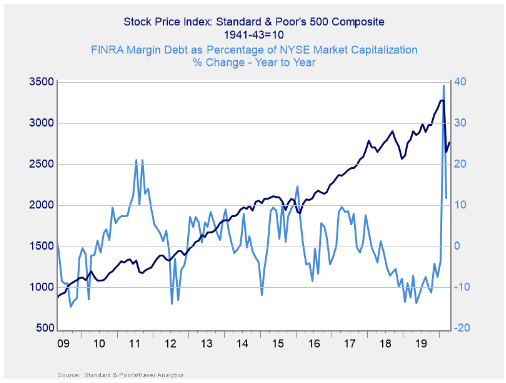
As you can see in the chart above, the annual change in debt as a percentage of market capitalization increased dramatically in February, before coming back partially in March. Despite the pullback during the month, this indicator is still signaling immediate risk due to the double-digit year-over-year growth. Given that, and the fact that the overall debt level remains high historically, it is worth watching. So, we are keeping this indicator as a red light.