


Signal: Red light
Risk factor #3: Technical factors. A good way to track overall market trends is to review the current level versus recent performance. Two metrics we follow are the 200- and 400-day moving averages. We start to pay attention when a market breaks through its 200-day average, and a break through the 400-day often signals further trouble ahead.
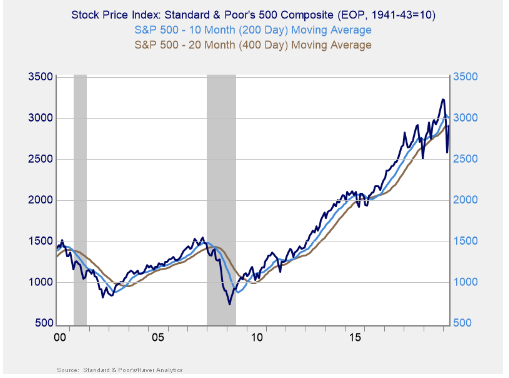
Technical factors for U.S. markets were mixed during the month. The S&P 500 and Dow Jones Industrial Average both spent April under their respective 200-day moving averages, although they moved notably closer to the trend line by month-end. The S&P 500 was even able to break above its 400-day moving average by month-end. The Nasdaq was the only major U.S. equity market to finish April above its 200-day moving average.
The 200-day trend line is an important technical signal that is widely followed by market participants, as prolonged breaks below this trend line could indicate a longer-term shift in investor sentiment for an index. The 400-day trend line is also a reliable indicator of a change in trend. As we saw in April, the S&P 500 was unable to rally above its 200-day moving average; however, the fact that it broke above the 400-day trend line is encouraging. Despite the rebound in April, we’ve kept this signal at a red light given the fact that the S&P 500 remained below its 200-day moving average at month-end.