


• Each month for many years, GMO has published its forward return forecasts. There has been a high correlation over time between what GMO predicted and what turned out to be. An approximate 0.97 correlation, actually. That’s as close to the middle of the fairway as any forecaster has hit the ball, as far as I know, which is why you really need to take this forecast seriously.
• In 1999, GMO predicted a -1.9% annual real return over the following seven years for large-cap stocks. “Real” means after inflation. Everyone was racing into tech stocks back then – I’m sure you remember. The actual returns turned out even worse than GMO had forecast. I should note that in 1999 GMO, led by the venerable and brilliant Jeremy Grantham, was seeing a lot of money take flight from its management programs because investors had concluded that Jeremy just didn’t get it. Those investors, many of whom went into conventional momentum-based strategies, then had their heads handed to them, messily, in the next two years. GMO’s assets rose spectacularly during and after the subsequent bear market. We are seeing the pattern repeat today. GMO is once again bleeding assets because investors still don’t think that Grantham gets it. They’ve decided his management style is simply antiquated and his forecasts j ust can’t be right. Sometimes they really do ring a bell.
• As of February 2017, GMO is forecasting a -3.8% annual return for US large-cap equities and a -0.8% for US bonds over the coming seven years.
• With a richly priced market (expensive hamburgers) and GMO’s strong return forecast history, we find it illogical and unwise to chase into passive buy-and-hold ETFs and index funds at this time. Yet that is what is happening.
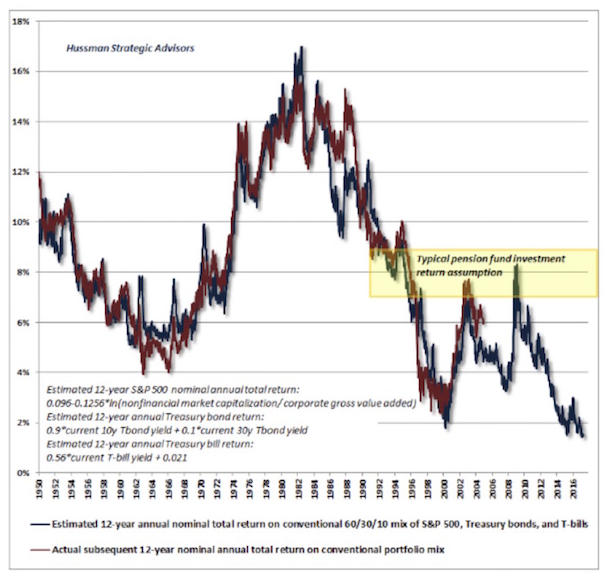
Hussman’s 12-year Return Forecast
John Hussman shared this next chart, and it shows that his 12-year forecast is for 0% to 2% returns before inflation. This is a portfolio based on 60% equities, 30% Treasury bonds, and 10% Treasury bills. Basically, a typical 60/40 portfolio. Question: Do you really think there will be 0% inflation over the next 12 years?
What about Drawdowns?
The following chart is a look at the downside risk by valuation quintile.
When valuations are highest, not only are returns lowest but risk is highest. This chart shows that from where we are today we should expect an 18% drawdown in an average case and a worst-case -51% if there is a recession (more recession probabilities in a moment).