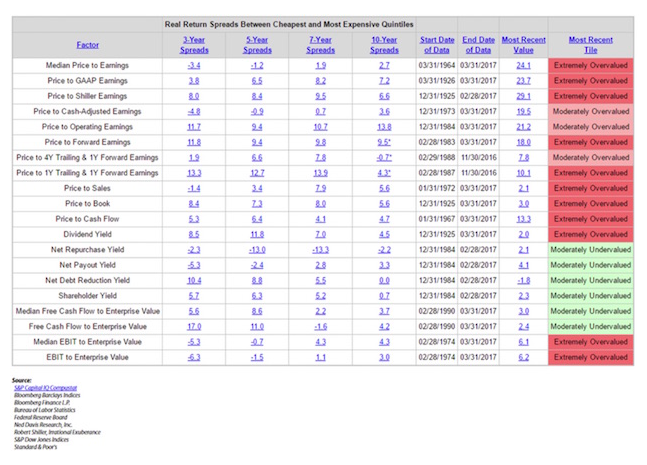
The chart below looks at 20 different ways you can value the stock market. Note that it is possible to come up with valuation metrics that show the market to be moderately undervalued. Most of those methodologies have something to do with yield.
That being said, look to the far right – most valuation metrics are “Extremely Overvalued.”
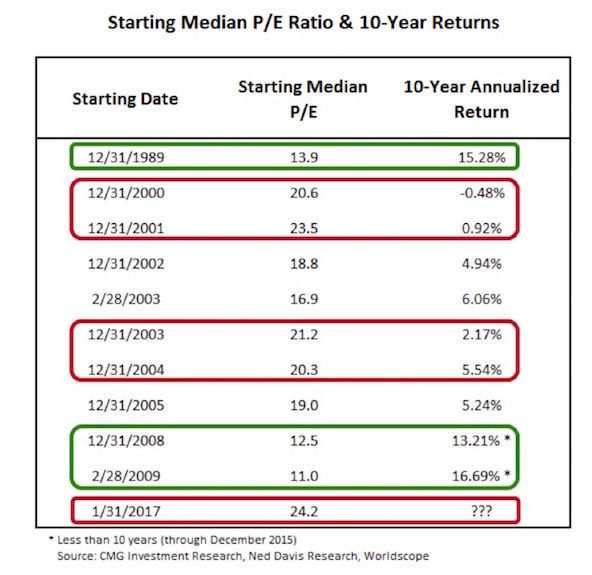
Median P/E – Selected Dates
(This next section is basically from Steve, triggered by a discussion he had with a reporter from a mainstream media business journal. The journalist was struggling to understand the concept of projecting future returns based on current P/E ratios. Steve gave her the following chart.)
To make this discussion a little more real, I selected several dates to give you an idea as to what the median P/E was then and what the subsequent annualized 10-year return turned out to be.
• Green is low P/E, high subsequent returns
• Red is high P/E, low subsequent returns
Take a look at the December 2002 median P/E of 18.8. A month prior, on November 11, 2002, Warren Buffett said, “The bubble has popped, but stocks are still not cheap….” He was right. The return over the subsequent 10 years was just 4.94%. Gentle readers, we sit at a median PE of 24.2 today – higher than at any other point in the above chart. Caution!
Earnings Estimates
We use median P/E because analysts have historically been too optimistic in their earnings forecasts. This is why we don’t – and don’t believe you should – trust Wall Street estimates.