


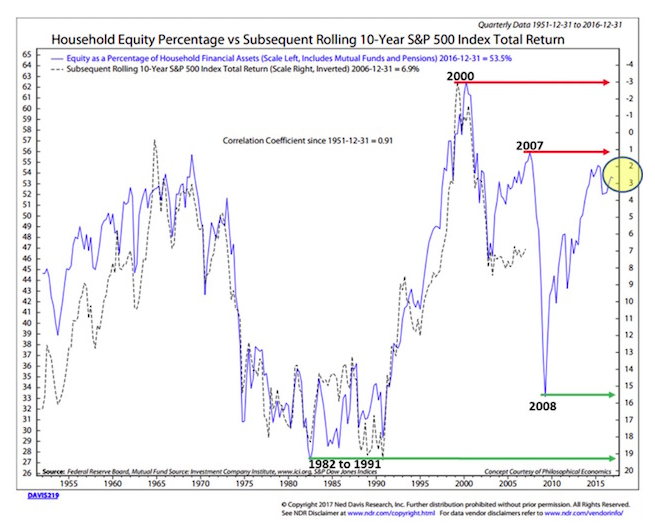
• Look how closely the dotted black line tracks the blue line over time.
We can use this chart as a guide. We will share it with you from time to time. The point is that we want you to be prepared to overweight stocks when the getting gets good. The hard part is that you’ll need to be a buyer when everyone around you is panicking. That’s when opportunity is always best. But for now, if you are betting that we’re at the beginning of a new bull market, you are really expecting this time to be different.
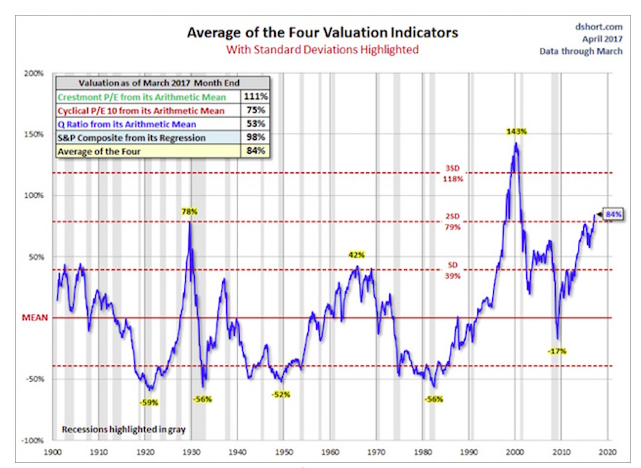
Average of Four Valuation Indicators – Way Above Trend
Here’s how you read this next chart:
• The chart is a simplified summary of valuations obtained by plotting the average of four arithmetic series. It also shows standard deviations above and below the mean.
• Standard deviation measures extreme moves away from normal trend
• The four valuation metrics are the Crestmont PE, the cyclical PE10 (similar to the Shiller PE), the Q ratio, and the S&P composite from its regression.
• Note the far-right number on the chart: 84%. That’s our current valuation, and it’s two standard deviations above trend – the second-most overvalued reading in the data series history.
Valuations – Everything Else: Price-to-Sales, Price-to-Operating Earnings, Etc.
Stock Market Valuations And Hamburgers
April 11, 2017
« Previous Article
| Next Article »
Login in order to post a comment