Rotation, Rotation, Rotation
Last November, when excellent vaccine test results sparked a surge in stocks that had suffered most from the pandemic lockdown, it was still possible to doubt whether there had been a true market rotation. The initial drama was followed by a month or two of dithering. That doubt is over. The market is unquestionably going through a major shift. The question is how long it will continue.
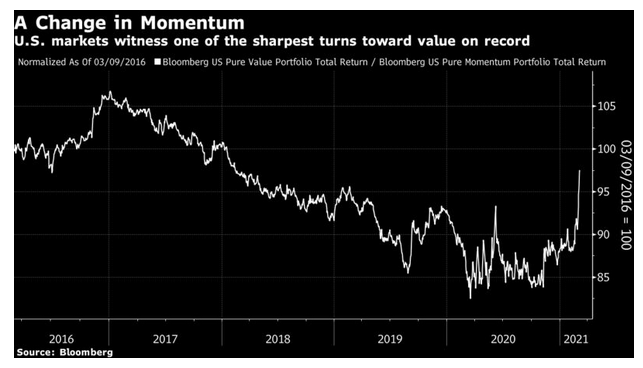
Within the stock market, the rotation is most pronounced in the move from “momentum” stocks, which had previously been winning, to “value” companies, which look cheap compared to their fundamentals. That change, by Bloomberg’s measure, is about as violent as any in history:
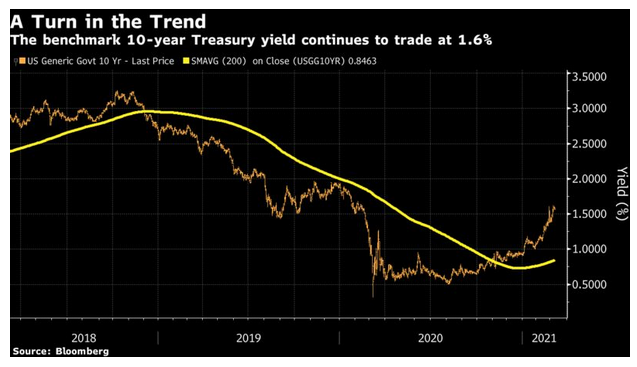
The underlying driver for stocks is the bond market. The rotation toward higher yields in bonds has slowed a little but not stopped, and the benchmark 10-year Treasury yield topped 1.6% again in Monday trading. Its trend now appears to be plainly upward:
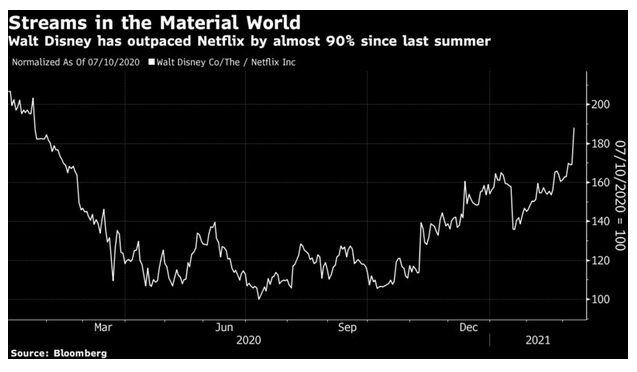
Underlying the move in bonds is a shift in views about the economy, driven in part by the news from Washington that Democrats should be able to push through a $1.9 trillion stimulus package. Meanwhile, there is also excitement over the fight against the pandemic, with the likely reopening date for the economy steadily moving forward. For one dramatic demonstration of this, watch the relative performance since the beginning of last year of Netflix Inc., a pure play on streaming at home, and Walt Disney Co., a bet on streaming content that also comes with a large theme park business. Disney still lags Netflix since the beginning of last year, but has outperformed it by almost 90% since its nadir last July:
So, a rotation is under way. That raises many questions—far too many to answer here. But here are some of the more important issues.
What’s Bubbling?
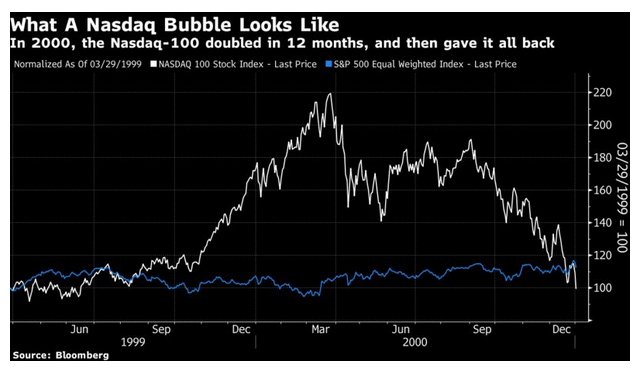
The question of whether we are in a stock market bubble persists. A lot depends on how to account for the undoubted prop that the market receives from low bond yields. But to an extent, the point of a bubble is that it goes beyond a point where valuation matters; it is already overvalued and the question is how overvalued it can become. That is a question of mass psychology, which can be revealed in stock charts. This is one of those times when looking at patterns in prices can have some relevance.
The greatest fear is that we are staging a repeat of the great dot-com bubble that burst almost exactly 21 years ago. Rather than look at the highly speculative dot-coms that went to market without profits or even revenues to their names, this chart compares the Nasdaq-100, a tech-dominated group of large companies, against the equal-weighted version of the S&P 500, a measure of the performance of the “average stock.” As can be seen, this was a bubble for the ages: