This combination of indications appears much superior to the sole use of current withdrawal rates, but it is admittedly far from perfect. The “stressed portfolios” I recommend using as standards are for unique, stand-alone events. They reflect sequences of returns and sequences of inflation and might not work in future scenarios, even those that could be grouped as part of the same inflationary regime. There is a possibility in these for false or improperly sized signals to be generated. But it seems to me they are a reasonable starting point for our analysis. Judgment, and continual monitoring, will still be required.
Part 3: Correcting A Failing Portfolio (Case Studies)
Annuities and reverse mortgages have been explored by others in detail as means of enhancing retirement income. Those are beyond the scope of the article. Instead, I intend to focus on one primary corrective tool for portfolios: reducing dollar withdrawals to an appropriate level.
To illustrate the application of the principles outlined in the preceding section, I am going to present two case studies. I invite the reader to examine the evidence provided, formulate a diagnosis and develop an appropriate “course of treatment” if one is needed. See if you agree with my conclusions.
Note that with each case study, I include information about valuations for S&P 500 stocks. Michael Kitces has demonstrated quite convincingly that there is a strong negative correlation between the “safe” initial withdrawal rate and market valuations, as represented by the Shiller cyclically adjusted price-to-earnings ratio (CAPE). I believe that is an important piece of data advisors should consider when assessing the health of a withdrawal plan.
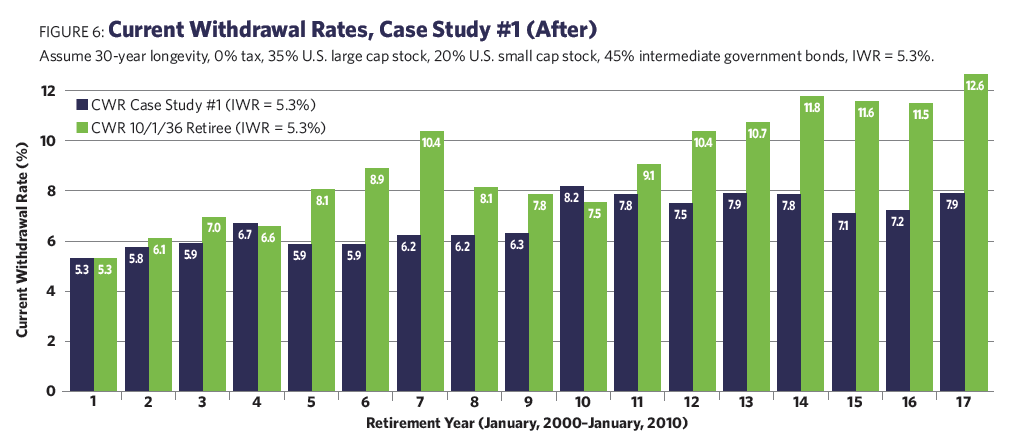
Case Study #1: Figure 5 presents the current withdrawal rate progression for a client’s portfolio, compared to the appropriate “inflation regime” current withdrawal rate chart.
In this case, the retiree, who retired January 1, 2000, just completed the 10th year of a 30-year plan, and walked into your office in early January 2010. The initial withdrawal rate was 5.3%. The Shiller CAPE at the start was 44.2 (the long-term average was 16.8). The current Shiller CAPE was 20.3.
In this case, inflation was modest for all 10 years, with no signs of acceleration. The 10th-year current withdrawal rate was 8.2% (compared to 7.5% on the moderate inflation regime chart).
The Pros: The retiree chose an appropriate initial withdrawal rate of 5.3% (the moderate-inflation regime). Inflation was moderate for the entire duration of the plan.