


The Cons: The current withdrawal rate was higher than the “worst-case,” 8.2% versus 7.5% on the regime chart. Stocks are not cheap in this regime, nor are they very expensive.
Recommendations: What action, if any, should be taken to resuscitate this withdrawal plan?
The pros appear to outweigh the cons; therefore, we defer action.
The recommendation is that we make no changes in dollar withdrawals and continue to monitor the plan.
Fortunately, since this scenario was based on a historical portfolio (for the January 2000 retiree), we can “view” the results of our handiwork! This retiree experienced two major bear markets in less than a decade. With only 17 years of data available, the fate of this portfolio is still uncertain.
However, the “vital signs” of the portfolio have improved over the last seven years. The current withdrawal ratio (Figure 6) is trending well below the current withdrawal rate of the moderate-inflation standard. Things don’t look too bad—for now.
Case Study #2: Figure 7 presents the current withdrawal rate progression for this client’s portfolio, compared to the appropriate “inflation regime” current withdrawal rate chart.
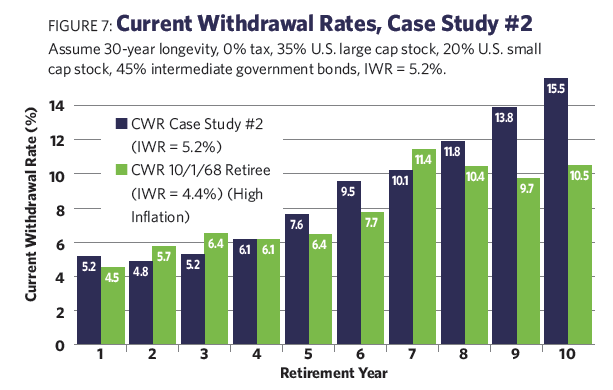
In this case, the client just completed the 10th year of a 30-year plan. The initial withdrawal rate was 5.2% (arbitrarily chosen by the client). The Shiller CAPE at the start was 15.6 (the long-term average was 16.8). The current Shiller CAPE is 13.7.
Inflation was moderate during the first two years, but it was at double-digit levels for the last eight years.
The Pros: The retiree was conservative with his initial withdrawal rate; expecting a moderate inflation environment to persist, he still chose slightly less than the corresponding SAFEMAX of 5.3%.