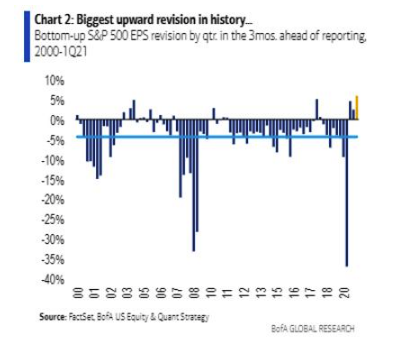
In conditions like this, brokers are struggling to keep up with what is happening on the ground, and will inevitably be more than usually prone to mistakes. The same is true of the corporate investor relations departments who feed them information. According to BofA Securities Inc., brokers revised S&P 500 forecasts upward by the most in any quarter this century. Usually, estimates come down during the quarter as companies try to set a bar for themselves they can beat:
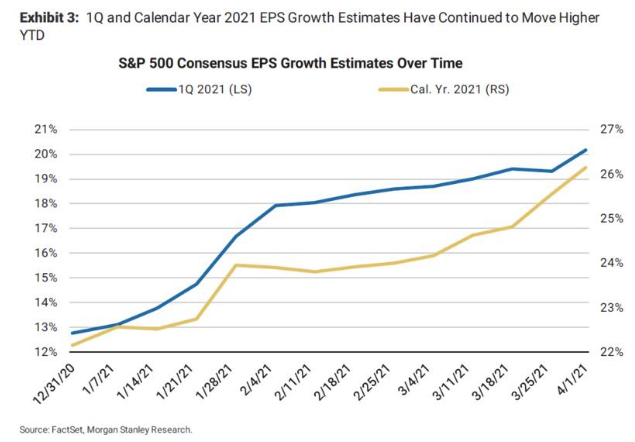
And, as Morgan Stanley shows, that rise in expectations took place more or less constantly throughout the quarter, and affected estimates for the period and the year as a whole:
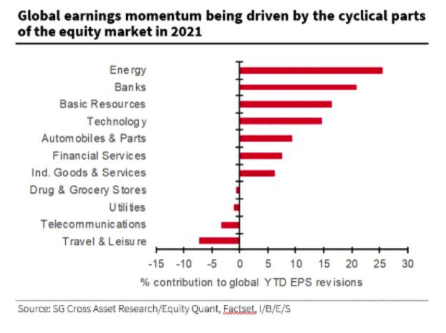
When we look at which companies have enjoyed the greatest upgrades, the cyclical nature of what is going on becomes clearer. Naturally, energy stocks, beneficiaries of higher oil prices, have seen the strongest upward revisions. They are followed by banks and resources. Meanwhile, though the travel and leisure sector, which has been hurt more by the pandemic than any other, has seen outright downgrades. This is an important clue that there are still doubts over exactly how quickly the economy can exit the pandemic slowdown. The chart comes from Andrew Lapthorne, chief quantitative strategist at Societe Generale SA:
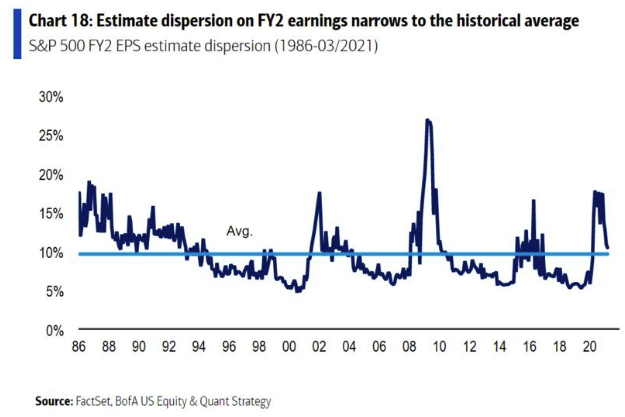
Wall Street seems to think it has more of a handle on next year, with the total range of estimates now narrowing down almost to its typical range. But unpleasant surprises could easily change that:
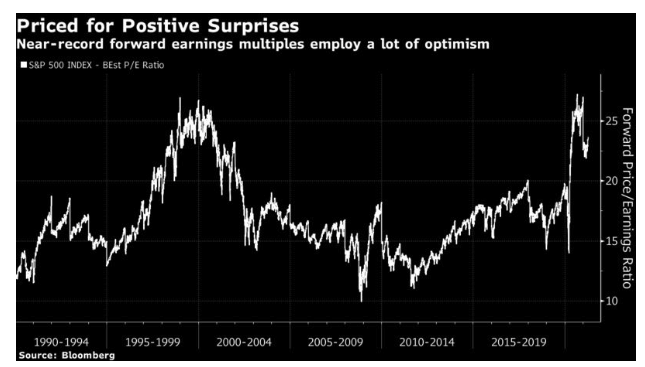
In the near term, stock markets are in the uncomfortable Lewis Carroll state of expecting to be surprised. Looking at multiples of expected earnings for the year as a whole, as reported to Bloomberg, the S&P 500 is expensive as it has ever been, barring the very top of the dot-com boom, and a few weeks at the end of last year. Such high prospective multiples imply either an elevated confidence in continuing growth after this year, or a resolute belief that near-term earnings will be better than the consensus numbers reported to Bloomberg:
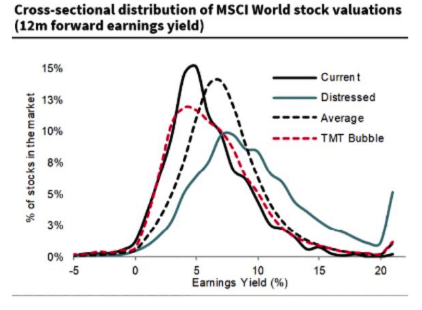
This isn’t only an American phenomenon. Indeed, if we look at the MSCI World index, which includes all the main developed markets, there is an even heavier bias toward extremely expensive companies than there was 21 years ago. According to SocGen, the average stock in the MSCI World is up 20% from the end of 2019, and yet 12-month consensus forward earnings projections are only 3.7% higher. The following chart from SocGen shows the distribution of earnings yields (the inverse of the price-earnings multiple, so that lower yields are more expensive). The current distribution is more skewed toward the most expensive companies than in 2000, and also lacks the usual “tail” of very cheap stocks: