


There will plenty more inflation talk this week, with U.S. CPI data for September due on Wednesday. Here are the main points to watch:
Commodities
Energy prices are rising the world over, and this terrifies people. The echoes of the 1970s are obvious enough, even without the intrusion of Big Power politics as countries compete over resources.
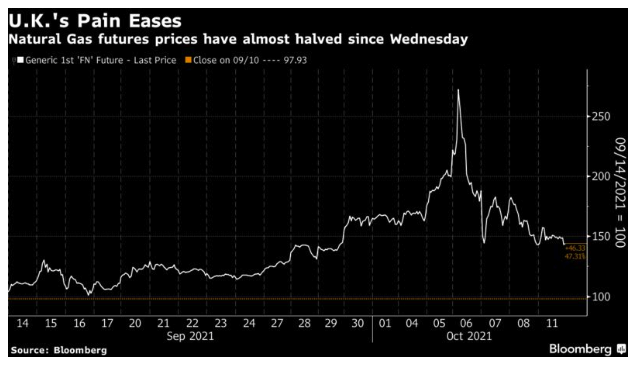
However, the most eye-catching crisis, in the U.K., has seen some easing of the pain in the last few days. The main natural gas futures contract for the U.K. has roughly halved since its peak last Wednesday. The fall seemed to start with a few words from Russian President Vladimir Putin about making more natural gas supplies available, which is alarming. But the fact remains that the most extreme energy scare to date has eased in intensity over the last few days:
Beyond that, the oil market has plainly hoovered up the most attention. But other corners of the commodity market may be more concerning. The Commodities Research Board RIND index covers a group of industrial materials that are not available on futures markets, and so may better reflect the pure pressures on supply and demand into industry, rather than picking up speculative flows driven in other markets. It includes commodities such as burlap, tallow and lard. And this motley assortment of commodities is now almost at an all-time high:
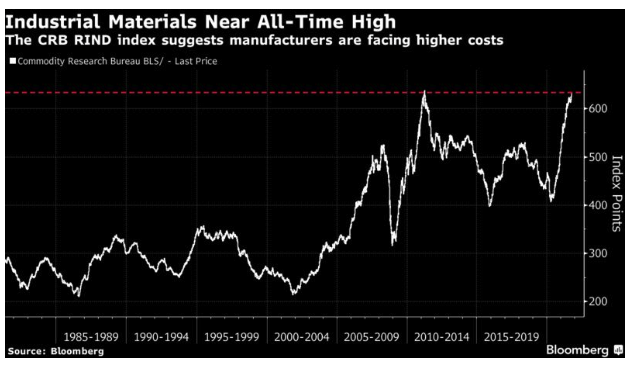
The surge in prices is still not quite as great as the rise that brought it to the previous peak in 2011, just before commodities lapsed into a decade-long bear market. But the signs of pressure are unmistakable.
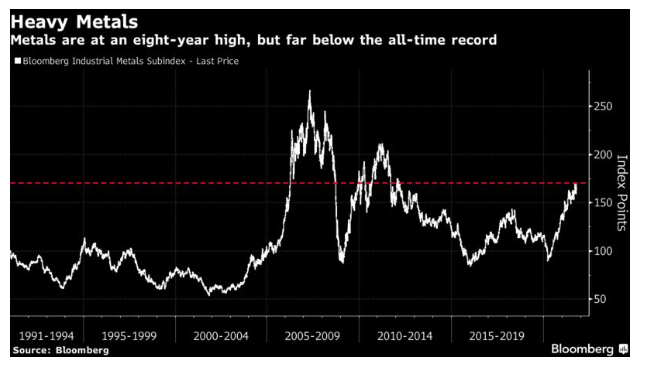
Then there is the move in industrial metals, which are normally driven by demand from China. At present, China is trying to douse speculation in metals, but that hasn’t stopped a surge in prices. Bloomberg’s industrial metals index is now at its highest since early 2012:
In the indicators, note that they are driven by levels, rather than percentage increases. This is on the theory that it is high absolute prices that create economic damage. Had we based the indicators on rates of increase, which is what many in the market tend to watch, the heat map would be implying much more inflationary pressure than it currently shows.