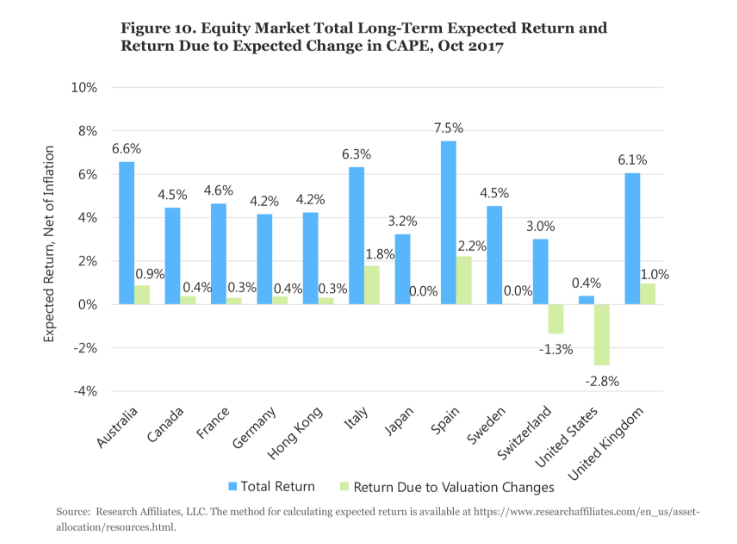
An individual market’s returns are volatile and can stray far from the forecasts implied by valuation models. Masturzo (2017) documents that the 10-year return often deviates as much as 4 percent from the forecast implied by the CAPE ratio alone. In the spirit of that analysis, let’s take a look at other valuation metrics.
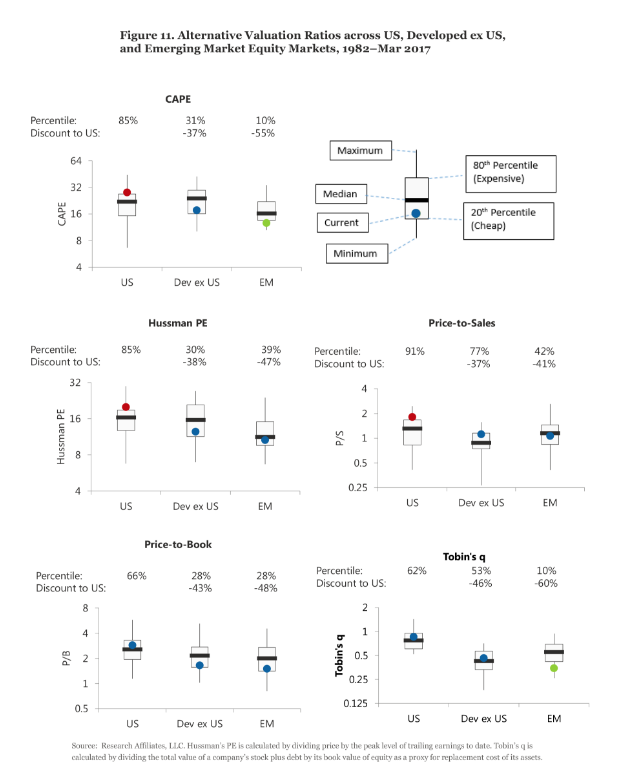
As much as we may beat the drum for CAPE, it’s hardly the only game in town. We look at the Hussman PE, price-to-sales ratio, price-to-book ratio, and Tobin’s q (Figure 11). A comparison of CAPE with these four valuation metrics, each against its own time series, shows the US market has been on the high side of the historical trend of all five metrics for some time. We find that developed ex US equity markets are cheap based on three of the five metrics relative to their respective historical norms, and that emerging equity markets are cheap based on all five measures. Relative to the US market, developed ex US equities are priced 37 percent to 46 percent cheaper, and emerging market equities are priced 41 percent to 60 percent cheaper.