Low Yields And Valuations
The so-called Fed model presents another argument for changes in discount rates that impact CAPE. The Fed model (a misnomer because the Fed neither owns it nor relies on it) compares the one-year forward equity earnings yield to the interest rate on nominal bonds. Investors have a choice between stocks and bonds, and the Fed model assumes that if the yield on bonds is higher than the yield on stocks, investors will sell stocks and buy bonds until the yields converge, and vice versa. The Fed model is often used to justify higher equity multiples (lower earnings yields). Accordingly, if the 10-year Treasury is yielding 2.3 percent, then a CAPE multiple of 32, which corresponds to a cyclically adjusted earnings yield (CAEY) of 3.1 percent, is cheap.
Consider the several problems with this logic. First is the fundamental conflict of comparing nominal bond yields with real equity earnings yields. Second, investors are not limited to just these two asset classes. Finally, we must consider the situation in the 1950s: If 2 percent yields would justify lofty CAPE ratios today, why did 2 percent yields not propel the CAPE to lofty levels in the 1950s? In that decade the CAPE ratio ranged from roughly 10 to 20, for an earnings yield of 5 percent to 10 percent, a huge mismatch with 2 percent Treasury yields. And, today, if 2 percent yields justify CAPE ratios of 32 in the United States, why do 0 percent yields coexist with 16x CAPE ratios in Europe?
Let’s nail the coffin shut on the Fed model with some historical evidence.
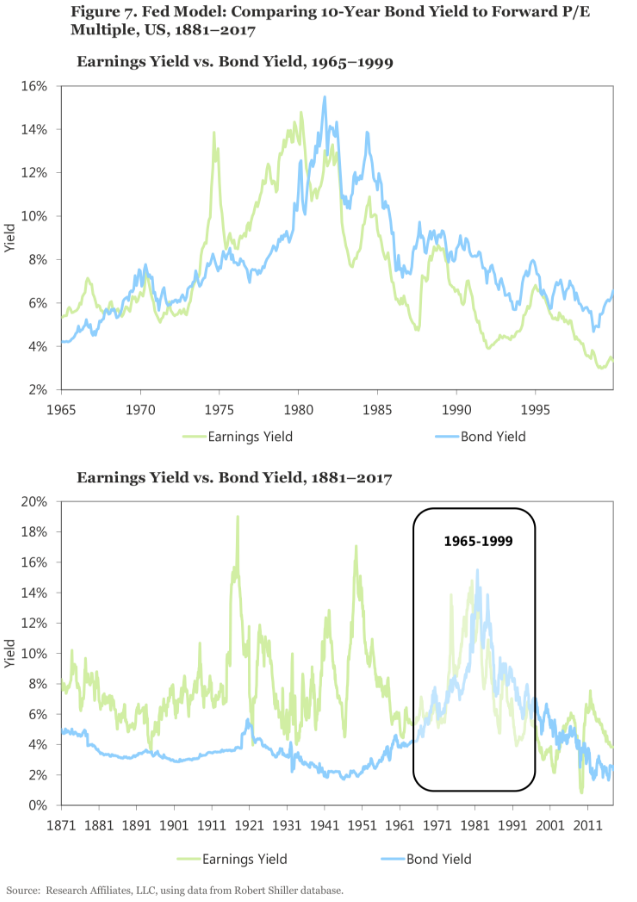
During the 1990s, the Fed model gained popularity because of the CAEY’s wonderful fit with the 10-year Treasury bond yield over the period 1965–1999, as illustrated in Figure 7, Panel A. Panel B spans the much longer period of 1881–2017. No one would suggest a linkage based on the terrible fit before 1965, nor would anyone suggest a linkage after 1999. What was special about 1965 to 1999? During these years inflation was soaring, then tumbling, driving nominal interest rates first higher, then lower. By driving economic uncertainty up, then down, inflation had a like impact on stock market earnings yields. The result was a unique span of time in which stocks and bonds exhibited an aberrant positive correlation. As has been well documented in the academic literature, the correlation between stocks and bonds becomes starkly positive when inflation is above roughly 3 percent, but a strong relationship is not observed between inflation and stock–bond correlation when inflation is below 3 percent (e.g., Ilmanen, 2003).
We can summarize our view of the CAPE skeptics’ arguments as follows: First, the arguments in support of future high EPS growth are rather weak. EPS growth is notoriously hard to predict and extrapolating recent history to estimate the future is a terrible way to forecast future growth. Second, the arguments related to inaccuracies in earnings measurement reveal that alternative measures are no less prone to problems. Third, the arguments for a higher CAPE ratio due to changes in the discount rate also raise many questions. Current very low macroeconomic volatility does imply an elevated equilibrium CAPE ratio, but only of about 23; the current CAPE ratio is 40 percent higher. More important, the low discount rate driving a higher equilibrium CAPE ratio implies a lower future return from depressed returns over the long run, and an even worse outcome if valuations mean revert toward historical norms.