Key Points
• The CAPE (cyclically adjusted PE) ratio is not a useful timing signal for market turning points, but is a powerful predictor of long-term market returns.
• Many arguments have been offered to justify elevated CAPE ratios. Most or all of the factors underlying these arguments are inherently temporary and subject to either near-term or eventual mean reversion. Beware the consequences of assuming that elevated CAPE ratios are here to stay, but if they are the “new normal,” low future returns will be as well.
• We can have a spirited debate about whether the equilibrium US CAPE ratio is 16 or 20 or a notch higher. But at 32 times 10-year average earnings, no matter what adjustments we make, the US market is expensive.
US CAPE (cyclically adjusted price-to-earnings, or Shiller PE) ratios are at levels previously reached only in 1929 and during the tech bubble. In the fall of 2017, the US stock market surpassed a CAPE ratio of 32, nearly double its long-term historical norm of 16.6. Whenever the Shiller PE suggests caution, CAPE skeptics abound, explaining why we should turn away from the warnings of a high CAPE ratio. Should we fear the lofty valuation multiples, or should we fear the CAPE ratio itself because of its notorious unreliability in picking market peaks and troughs?
Jeremy Grantham—until now, a vocal advocate of caution when CAPE ratios are stretched—argued recently “this time seems very, very different” because current high CAPE ratios are supported for structural reasons, reflecting high earnings growth rates driven by “increased monopoly, political, and brand power” (2017). Our view is that Grantham’s arguments explain high past earnings growth, and may be relevant for near- to mid-term valuation levels, but are far less informative about future growth rates.
Several additional factors, such as low real interest rates and low volatility in GDP and in inflation rates, can also support elevated equilibrium CAPE ratios. None of these arguments offers any reasonable hope that the US stock market can deliver long-term returns in line with historical norms. Most of these factors drive equilibrium valuation levels higher through a lower discount rate, which suggests low expected returns for many years to come, even without any mean reversion in the CAPE ratio. Each of these factors is likely to be temporary; if the rationale for high multiples goes away, then we’ll get mean reversion in CAPE, possibly as a severe market downturn. Moreover, CAPE naysayers tend to focus on the reasons CAPE could remain high, and overlook the reasons related to demographics and rising inequality that could cause US CAPE to fall.
Finally, these same arguments in favor of a high CAPE would also justify high multiples in many other countries, and yet when we examine valuation ratios—CAPE ratios and others—in non-US developed and emerging markets, we find most non-US markets are far less expensive than the US stock market based on almost any measure we use, and more important, the spread has rarely been wider. Investors ignore the warnings of high US CAPE ratios at their peril.
Is Cape Permanently Elevated?
Since 1996, the US CAPE ratio has been above its long-term simple average (16.6) 96 percent of the time, and above 24, roughly one standard deviation above its historical norm, more than two-thirds of the time. This dislocation is long enough to make even the most ardent fans of CAPE, such as Jeremy Grantham at GMO and our team at Research Affiliates, take pause. Grantham, whom we greatly admire for his courage and investment acumen, famously announced in late May 2017 that high valuations are here to stay, offering an affirmative answer to the question: Is the tried-and-true hammer of value investors—comparing CAPE to its historical statistics—broken?
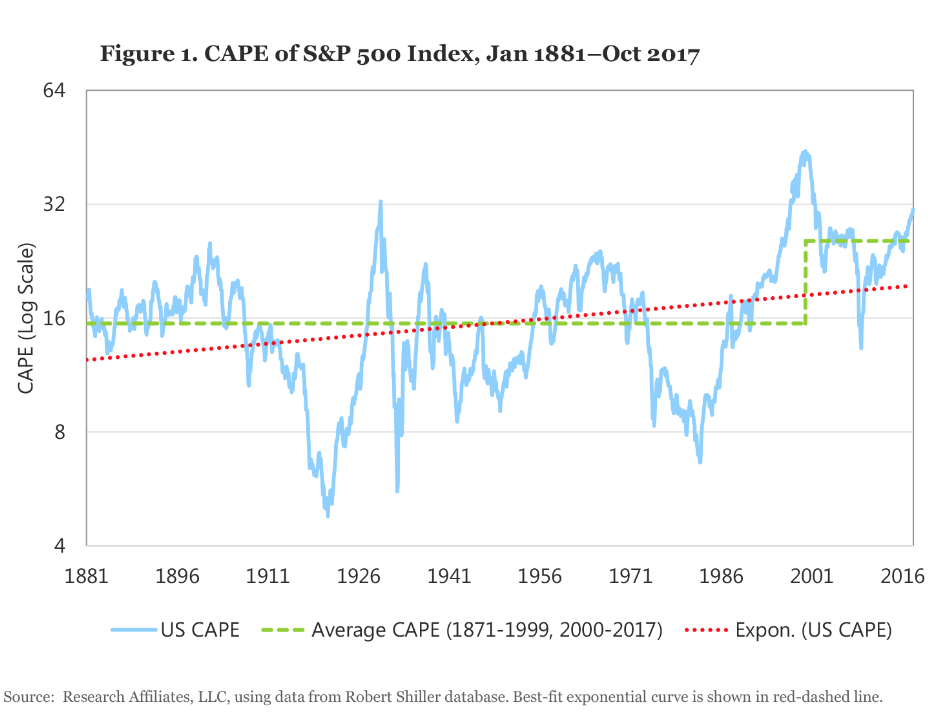
We believe the correct answer is far more nuanced than a simple “yes.” Most of us who use CAPE as a valuation tool readily accept that CAPE is only one measure of valuation, and that—as American investor Stan Druckenmuller likes to point out—capital flows drive short-term market behavior far more powerfully than valuation. Going back to the early 1990s, one of us (Arnott) has always preferred to show historical CAPE as an upward-sloping best-fit line (the red dashed line in Figure 1) in tacit acknowledgment that its equilibrium level is not static, and that it should rise as the US market matures and becomes more efficient. Let’s not forget that in 1881 the United States was an emerging market by modern standards!
The best-fit line for US CAPE, a simple view of the measure’s evolving estimation of fair value, starts at about 12x in 1881, when the nation was still an emerging market, and finishes at about 19x in October 2017. CAPE’s imprecision is illustrated by its always exceeding the estimated fair-value trend line over both the first quarter-century and the latest quarter-century, except briefly in 2008–09. Grantham’s is also a simple view (we doubt he’d disagree), illustrated by the step function of the green dashed line in Figure 1 (Grantham, 2017); before the mid-1990s, the normal valuation was in the mid-teens, and in the mid-twenties thereafter.