


Conclusion
Every time the CAPE ratio suggests caution, CAPE skeptics suggest we should ignore it. We are highly confident those offering eulogies today for the CAPE ratio are premature—as has been the case repeatedly in the past. We readily acknowledge that the historical average CAPE of 16.6 is a poor guess for today’s equilibrium valuation level, as both Jeremy Siegel and we at Research Affiliates have written about in the past. But even after dickering over accounting rules and growth rates, the fact remains the US equity market looks expensive. If we take out the extremes of 2009, perhaps the current multiple is closer to 29 than 32. If we adjust for accounting rules, perhaps the equilibrium is 20. When the US CAPE hits 20, then we can have a spirited debate about whether we’ve reached fair value or are still a little richly priced.
What is often lost in the conversation of the “right” level of CAPE is an appreciation for expectations of return in the absence of any mean reversion. Real EPS trend growth since 1871 has been 1.5 percent. From all-time peak earnings, as a share of GDP, dare we expect more growth than this? With a dividend yield of 2.0 percent, this gives us a real return (yield plus growth) of 3.5 percent, if valuation levels 10 years hence are exactly where they are today. From current valuation levels, dare we expect PE expansion? If not, the maximum likely return over the next decade is 3.5 percent. Mean reversion to a value of 23 would deliver a scant return of 30 bps a year, whereas reversion to the historical average CAPE ratio of 16.6 would result in a loss of −2.8 percent a year; both scenarios are net of inflation, but include the positive impact of dividends. Returning to the median valuation level since 1990 would take us to a near-zero real return.
To earn an annualized 5 percent real return over the next 10 years with a 2 percent dividend yield, we’ll need 3 percent real share-price growth. If half the 3 percent growth comes from earnings growth (matching the trend growth rate since 1871) and half from PE expansion, the CAPE ratio a decade from now will need to be 37. When considering how to invest, we should ask ourselves: Are we comfortable with these heroic assumptions? Or do we want to invest in markets where sensible returns can be expected, based on sensible assumptions about future growth and mean reversion?
Appendix: Why Does Cape Forecast Returns?
Prior to the early 1980s, academics as well as practitioners used past equity returns as a gauge of expected equity market returns. In the academic world, however, everything changed with Shiller (1981).
He showed that market valuation volatility was not matched by a similar volatility in aggregate cash flow. This seemingly boring observation had the same effect, in (nerdy) academic finance circles, as detonating a bomb.
What is the significance of this observation? Let us remember that a company’s stock price reflects the valuation of an expected future stream of cash flows. Gordon and Shapiro (1956) developed a very simple model to value cash flows, later named the Gordon Growth Model, in which they assumed the rate of return and the growth rate of cash flows are constant. Under these heroically simplifying assumptions, the price-to-cash-flow ratio for a stock is equal to
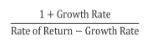
which means that a company’s stock-price-to-cash-flow ratio is a function of only two variables: future growth rate of cash flows and future rate of return. More specifically, a high price-to-cash-flow ratio means either that 1) the future growth rate of a company’s cash flows is high or 2) the stock is going to experience low future returns. Shiller observed that price-to-cash-flow valuation ratios were very volatile, while the growth rates barely changed; this meant that valuation levels must predict future equity returns.